Spectroscopy News
NTU Singapore has launched the S$160 million Institute for Digital Molecular Analytics and Science, which aims to advance the science behind analysing biomolecules through the use of information technology and data science.
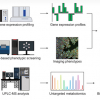
Researchers have developed a sample processing workflow using mass spectrometry and a modified Compound Activity Mapping platform.
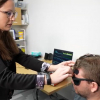
A team from Carnegie Mellon University have developed methods using NIR and diffuse correlation spectroscopies to monitor intracranial pressure non-invasively.
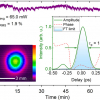
A new light source generates ultrashort infrared pulses at wavelengths around 12 µm with previously unattained peak intensity and stability. First experiments in vibrational spectroscopy on water demonstrate the high potential of the system for applications.
Native mass spectrometry is shown to be able to interrogate the pharmacology of the beta-1 adrenergic receptor, a G protein-coupled receptor, and has discovered the endogenous zinc ion as a positive allosteric modulator in well-studied receptor.
Physicists at the University of Texas at Arlington have developed a new technique that can measure the properties of the top-most atomic layer of materials without including information from the underlying layers.
IR s-SNOM has shown that the layer between the wood and varnish of two Stradivarius violins contained protein-based compounds, congregating in nano-sized patches.
A novel algorithm estimates intracranial pressure based on haemoglobin levels using near infrared spectroscopic cardiac pulse waveforms.
Multi-edge X-ray absorption spectroscopy at BESSY II and then the reverse Monte Carlo method to analyse the collected data have been used to study high entropy alloys.
A research team has developed a new type of spectrometer which is capable of simultaneous remote sensing of atmospheric methane, water vapor and nitrous oxide.
A new study has compared three different illumination systems for moisture prediction using hyperspectral imaging in the visible-near infrared range.
Large-scale, chemical-specific emissions information poised to aid development of greener airplane engines and fuels.
Scientists discover anomalous emission of terahertz radiation from copper oxides in which superconductivity coexists with charge-stripe order.
Infrared Diffusion-Ordered Spectroscopy separates molecules with different sizes into distinct sets of infrared peaks.
Shimadzu and Germany’s University Medical Center Göttingen are developing new clinical LC-MS methods for a more rapid and flexible therapeutic drug monitoring analysis.
Scientists have used ultrashort laser pulses to make the atoms of molecules vibrate and have gained a precise understanding of the dynamics of energy transfer that take place in the process.
At BESSY II, Auger photoelectron coincidence spectroscopy (APECS) can be used to precisely determine the localisation of d electrons in cobalt compared to nickel and copper.
Calcium content determines the peak intensity ratio due to iron ions at Mössbauer spectra in pyroxene.
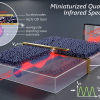
A proof-of-concept miniaturised Fourier-transform waveguide spectrometer that incorporates a sub-wavelength photodetector as a light sensor has been built.
Research involving two-dimensional semiconductors has led to an ultra-tiny spectrometer that fits on a microchip and is operated using artificial intelligence.


