Curtis Marcott,a Tadashi Awatani,b Jiping Ye,b David Gerrard,c Michael Lod and Kevin Kjollerd
aLight Light Solutions, LLC, Athens, GA, USA
bNISSAN ARC Ltd, 1 Natsushima-cho, Yokosuka, Japan
cBaker Hughes, Houston, TX, USA
dAnasys Instruments, Santa Barbara, CA, USA
Introduction
The ability to chemically characterise materials at sub-micrometre spatial resolutions is an important unmet need in today’s modern world of nanomaterials. Powerful chemical characterisation techniques like infrared (IR) spectroscopy have long been successfully employed to help understand the chemical nature and molecular composition of materials. Unfortunately, the spatial scale at which many important chemistries take place is often well below the diffraction limit of conventional infrared microspectroscopy (3–10 µm). In this article, instrumentation which combines Atomic Force Microscopy (AFM) and IR spectroscopy (AFM-IR) is applied to some important energy-related materials, including Nafion® fuel cell membranes, organic photovoltaic solar energy materials and a polymer blend material used in the oil and gas industry for hydraulic fracturing. The AFM-IR approach enables nanoscale chemical characterisation of small spatial domains in these important energy-related materials at levels not previously possible using conventional diffraction-limited Fourier transform infrared (FT-IR) microspectroscopy.
AFM-IR technique
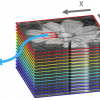
The AFM-IR technique used in all of the examples in this review article is based on the photothermal induced resonance (PTIR) effect. The technique was pioneered by Alexandre Dazzi using a pulsed tunable free electron laser source at Centre Laser Infrarouge d’Orsay (CLIO, Université Paris-Sud, France).1,2,3 A laboratory-scale IR light source tuneable between 900 cm–1 and 3600 cm–1 has been used for recent AFM-IR studies.4,5,6 Regardless of the light source employed, the AFM-IR technique is based on the use of an AFM tip in contact with the sample surface to detect the rapid thermal expansion of materials that occurs upon light absorbance when a short (e.g., 10-ns) pulse of monochromatic IR radiation matches the frequency of a particular molecular vibration. After absorption, the sample thermally expands when vibrationally excited molecules return to their ground state. The AFM tip detects the rapid expansion and contraction of the sample and causes the AFM cantilever to resonate at its natural mechanical frequencies. The ringdown amplitude of the cantilever is directly proportional to the actual amount of light absorbed at the sample surface.6,7 The cantilever ringdowns are measured by deflecting a visible laser off the top surface of the cantilever and detecting its instantaneous position using a four-quadrant photodiode. For all of the examples presented in this review, the illumination scheme is similar to attenuated total reflection (ATR) with the IR beam being reflected at the interface between the sample and a ZnSe prism. Nevertheless, the resulting AFM-IR spectra look more like absorbance spectra derived from IR transmission measurements and correlate well with spectra found in commercially available mid-IR databases. A schematic diagram of the AFM-IR experiment is shown in Figure 1.

Experimental
All AFM-IR measurements were made from a region where the sample film was in good contact with the ZnSe prism. A standard contact mode AFM cantilever, typically either an AppNano SICONA (Santa Clara, CA, USA) or a Mikromasch CSC37-ALBS (Tallin, Estonia), was used to collect the AFM-IR spectra and images. The IR laser power was set to approximately 0.3–0.5 mW by the Analysis Studio software (Anasys Instruments, ver. 3.4). At least three spectra sampled at a data point spacing of 4 cm–1 were collected and co-averaged at each location. A one-point smoothing routine was typically applied to the spectra using the aforementioned software. The IR spectra were calibrated against a polystyrene standard. The spectral resolution of the IR laser was approximately 4 cm–1. The spatial resolution achieved depends on the sample thickness, but is expected to be between 40 nm and 100 nm for the examples presented here. AFM chemical images can also be collected by tuning the IR source to a single wavenumber matching the frequency of a specific functional group absorption band to map compositional variations across the sample surface.
Nafion™ fuel cell membranes
Nafion is a perfluorinated sufonic acid material used in commercial proton exchange membranes (PEMs) in polymer electrolyte fuel cells.8 Its desirable properties include high electrical conductivity, thermal stability and chemical stability. Nafion consists of a hydrophobic poly(tetrafluoroethylene) backbone with hydrophilic sulfonic acid terminal groups connected via perfluorovinyl ethers. The water structures within PEM films like Nafion are important, as they directly influence the efficiency of proton exchange between electrodes and affect fuel cell performance.8 Hydration FT-IR spectroscopic studies have shown that hydrated free (bulk-like) water, bH2O, within the Nafion matrix has a peak IR absorbance at 3482 cm–1.9 On the other hand, water bound to the hydronium ion, iH2O, the OH-stretching vibrational mode of which is constrained due to interaction with the sulfonate ionic group, has a peak IR absorbance at the lower wavenumber of 3211 cm–1.9 Unfortunately, the spatial resolution of these conventional FT-IR microspectroscopic studies is limited by diffraction to about 3–10 µm. The AFM-IR spectroscopy approach used in this study allows for chemical infrared spectra to be obtained at spatial resolutions near 40 nm.
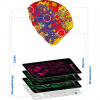
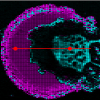
 bulk-like water at 3482 cm–1; (b) ionically bound water at 3211 cm–1; and (c) AFM-IR spectra at points C1 and C2. Image (a) and the spectra (b) show that bulk-like water and ionically bound water are distributed differently on the Nafion membrane surface.10")
Figures 2(a) and 2(b) show AFM-IR images collected at the same sample location with the pulsed laser source tuned to the two OH-stretching peaks at 3482 cm–1 and 3211 cm–1, respectively.10 Clear distinctions in the distribution of the different water structural states are observed. In Figure 2(a), the free (bulk-like) water, bH2O, distribution appears as thin string-like channels that elongate towards the lower right of the image. The iH2O bound water peak shown in Figure 2(b), on the other hand, reveals aggregated water clusters that differ in their distribution from that of the free water. Comparing the images in Figures 2(a) and 2(b), it can be seen that the bound water clusters appear at opposite ends of the free water channels.10 Figure 2(c) shows the AFM-IR spectra obtained at the two points, C1 and C2, which clearly confirms that the intensity of the bound water peak at C1 is lower than that of the clustered area at C2.10
These AFM-IR chemical imaging results have revealed ionically bound water molecules, iH2O, (absorbing at 3211 cm–1) that are clustered in domains, while the hydrated free bulk-like water molecules, bH2O, (absorbing at 3482 cm–1) are located within transportable channels that link these clusters. Future work is planned aimed at better understanding the hydration effect of these channels and clusters. It is expected that AFM-IR spectroscopy and imaging can provide additional valuable information about the mechanism of transport through these water channels that is essential for development of more efficient fuel cells.
Organic photovoltaics
There is a lot of current interest in organic photovoltaic materials as potential high efficiency, low-cost generators of electric power. One of the most extensively studied systems is formed from blends of poly(3-hexylthiophene) (P3HT) and [6,6]-phenyl-C61-butyric-acid-methylester (PCBM).11 The internal film structure and evolution during the typical thermal annealing processing of PCBM and 3PHT is a topic of intense debate. Nanoscale characterisation techniques are needed in order to develop a better fundamental understanding of the miscibility of P3HT and PCBM and its effect on the performance of these materials.
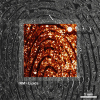
 as well as at several points surrounding a defect observed in the AFM topography image. The spectra reveal variations in the amplitude of the carbonyl peak (1728 cm–1) associated with higher concentration of PCBM. Stronger concentrations of P3HT cause a reduction in the carbonyl peak and a shift in the methylene bending absorption from 1432 cm–1 to 1444 cm–1.6")
The AFM-IR technique has been applied to bulk heterojunctions made of P3HT and PCBM.6,12,13 Figure 3 shows the structures of P3HT and PCBM, an AFM topography image of an annealed film of a P3HT–PCBM blend, and some AFM-IR spectra of bulk P3HT, bulk PCBM and five other specific locations indicated by coloured “plus” (+) signs on the AFM image.6,12,13 These measurements show spatially varying concentrations of P3HT and PCBM based on the characteristic IR absorption peak locations and intensities associated with the constituent materials. Defects indicative of phase separation of PCBM and P3HT components are commonly observed in such blends.11 The methylene bending modes at 1444 cm–1 and 1432 cm–1 correspond to P3HT and PCBM, respectively. The 1444 cm–1 band also contains a contribution from an overlapping ring, semicircle stretching mode. The spectrum from outside the defect region at the location of the yellow “plus” sign (spectrum 5) appears to have both components. A spectrum collected in the outer blue ring of the defect (red mark, spectrum 1) has a smaller peak at 1732 cm–1 due to PCBM while the component at 1444 cm–1 (due to P3HT) dominates. Spectra collected at both the green and purple “plus” marks (spectra 3 and 4) near the peak elevation at the centre of the defect, show a stronger band at 1432 cm–1 that mainly originates from the PCBM component. The sharpness of the band at 1432 cm–1 and a stronger 1732 cm–1 signal suggest the high elevation region at the centre of the image contains an excess of PCBM. By combining the AFM and IR into a single instrument, the topological information is readily correlated with the local chemical analysis. The above data suggest there is local phase separation and the defect is not likely due to some foreign contaminant, since there are no extraneous bands not found in the pure component spectra of either the P3HT or PCBM.
Nanoscale chemical characterisation of a polymer blend material used in an ultra high temperature high pressure hydraulic fracturing application
Hydraulic fracturing (often referred to as “fracking”) is a process used in the oil and gas industry where water, sand and chemicals are pumped underground in order to break apart the rock and release the oil or natural gas. The development of sealing materials capable of performing under ultra-high temperature high pressure (Ultra HTHP) conditions is critically important to the success of hydraulic fracturing operations. In addition to the extreme temperatures and pressures, Ultra HTHP environments will likely involve exposure of the sealing materials to extreme chemical conditions as well, as drilling and completion fluids are developed to withstand high temperatures while protecting component metallurgy and, more importantly, the reservoir itself. Ideally, one would like a sealing material capable of reliably withstanding temperatures above 300°C and pressures above 40 Kpsi, at pHs ranging from 2 to 10.
The challenge is daunting, but the industry, fortunately, has experience with a handful of materials that have proven themselves at conditions approaching those stated above. These materials include perfluoroelastomers (FFKMs), polyaryletherketones (PEEK etc.), polytetraflouroethylenes (PTFE) and ethylene–propylene diene monomer (EPDM) rubber. Using existing knowledge of these materials and their performance as the baseline, new polymeric systems are being developed to operate in Ultra HTHP conditions. The ability to characterise the thermal, physical and chemical properties of new systems at the near nano scale has accelerated their design, process development, and customisation to meet the variety of challenges waiting “down hole”.
A ~500-nm-thick microtomed section of a 50 : 50 polymer blend test material was analysed by AFM-IR spectroscopy and imaging. The purpose was to determine how well the sample was blended at a small spatial scale. Figure 4(a) shows an AFM topographic image of the sample with coloured dots indicating the locations where the correspondingly coloured AFM-IR spectra shown in Figure 4(c) were collected. Clearly identifiable regions with distinctly different IR signatures are observed. The red and blue spectra match those of the two known pure polymer components that make up the blend. Figure 4(b) shows an IR absorption image collected with the pulsed tunable IR laser source tuned to the fixed wavenumber of 1248 cm–1 where only one of the polymer blend components absorbs strongly. The arrows point to locations where much smaller domains of the second component are observed that would not be possible to detect using conventional diffraction limited FT-IR microspectroscopic imaging approaches. The purple spectrum, corresponding to the location of the upper left downward red pointing arrow in the AFM-IR image, clearly contains contributions from both the blue and red spectra.
 AFM topography image, (b) AFM-IR chemical image collected with the laser tuned to 1248 cm–1 where only one of the polymer blend components absorbs strongly. The three arrows point to locations where much smaller domains of the second component are observed, and (c) AFM-IR spectra collected from the corresponding coloured locations indicated on the AFM topography image.")
Figure 5 shows a second attempt to blend the same two polymer components under different processing conditions. In this case, there is clearly better mixing of the two components, but the red and blue spectra do indicate an excess of one component over the other. Figure 5(a) shows an AFM topographic image of the sample with coloured dots indicating the locations where the correspondingly coloured AFM-IR spectra shown in Figure 5(b) were collected.
 and AFM-IR spectra (b) of the same two polymer components shown in Figure 4, but blended under different processing conditions. The region at the centre of the image where the blue AFM-IR spectra were collected show a different level of mixing of the two components compared to the surrounding region where the red spectra were collected.")
 and AFM-IR spectra (b) of the same two polymer components as shown in Figures 4 and 5, but blended under different processing conditions. This time the mixing of the two components is more uniform.")
Upon further tweaking of the processing conditions based partially on the AFM-IR observations, it was possible to generate a more uniformly blended sample. Figure 6 shows the AFM topography image (a) along with several nearly identical AFM-IR spectra (b) collected at the various locations indicated on the image. Note that the diagonal lines seen in the AFM image are cutting marks from the microtoming process. This example shows how AFM-IR spectroscopy and imaging can be used to help accelerate the convergence of processing conditions to achieve desirable mixing and the eventual formation of a uniform blend which should lead to better performance of the end-use polymer under harsh Ultra HTHP conditions.
Summary
AFM-IR spectroscopy was used to chemically characterise three energy-related materials at nanoscale spatial resolutions. In the first case of the Nafion fuel cell membrane, long narrow bulk-like water channels were identified which connect regions of ionically bound water clusters. In the second example, a defect in an organic photovoltaic material consisting of a blend of P3HT and PCBM was identified as a region where there was a different level of mixing of the two pure components. In the third example, AFM-IR was used to speed the convergence to optimal processing conditions in an experimental polymer blend system aimed at producing superior seals in an Ultra HTHP hydraulic fracturing application. In each case, the extraordinary spatial resolution of the AFM-IR technique enabled the chemical characterisation of the system. Such sub-micrometre spatial resolution results could not have been achieved using conventional diffraction-limited FT-IR microspectroscopy.
References
- A. Dazzi, R. Prazeres, F. Glotin and J.M. Ortega, “Local infrared microspectroscopy with subwavelength spatial resolution with an atomic force microscope tip used as a photothermal sensor”, Opt. Lett. 30(18), 2388–2390 (2005). doi: http://dx.doi.org/10.1364/OL.30.002388
- A. Dazzi, R. Prazeres, F. Glotin and J.M. Ortega, “Analysis of nano-chemical mapping performed by an AFM-based (‘‘AFMIR’’) acousto-optic technique”, Ultramicroscopy 107(12), 1194–1200 (2007). doi: http://dx.doi.org/10.1016/j.ultramic.2007.01.018
- A. Dazzi, R. Prazeres, F. Glotin, J.M. Ortega, M. Alsawaftah and M. De Frutos, “Chemical mapping of the distribution of viruses into infected bacteria with a photothermal method”, Ultramicroscopy 108(7), 635–641 (2008). doi: http://dx.doi.org/10.1016/j.ultramic.2007.10.008
- C. Marcott, M. Lo, K. Kjoller, C. Prater and I. Noda, “Spatial differentiation of sub-micrometer domains in a poly(hydroxyalkanoate) copolymer using instrumentation that combines atomic force microscopy (AFM) and infrared (IR) spectroscopy”, Appl. Spectrosc. 65(10), 1145–1150 (2011). doi: http://dx.doi.org/10.1366/11-06341
- J. Ye, H. Midorikawa, T. Awatani, M. Lo, K. Kjoller, R. Shetty and C. Marcott, “Nanoscale infrared spectroscopy and imaging of a polycarbonate/acrylonitrile-styrene/butadiene blend”, Microscopy and Analysis 26(3), 24–27 (2012).
- A. Dazzi, C.B. Prater, Q. Hu, D.B. Chase, J.F. Rabolt and C. Marcott, “AFM-IR: Combining atomic force microscopy and infrared spectroscopy for nanoscale chemical characterization”, Appl. Spectrosc. 66(12), 1365–1384 (2012). doi: http://dx.doi.org/10.1366/12-06804
- A. Dazzi, F. Glotin and R. Carminati, “Theory of infrared nanospectroscopy by photothermal induced resonance”, J. App. Phys. 107, 124519 (2010). doi: http://dx.doi.org/10.1063/1.3429214
- K.A. Mauritz and R.B. Moore, “State of understanding of Nafion”, Chemical Reviews 104(10), 4535–4586 (2004). doi: http://dx.doi.org/10.1021/cr0207123
- A. Gruger, A. Regis, T. Schomatko and P. Colomban, “Nanostructure of Nafion membranes at different states of hydration. An IR and Raman study”, Vib. Spectrosc. 26(2), 215–225 (2001). doi: http://dx.doi.org/10.1016/S0924-2031(01)00116-3
- T. Awatani, H. Midorikawa, N. Kojima, J. Ye and C. Marcott, “Morphology of water transport channels and hydrophobic clusters in Nafion from high spatial resolution AFM-IR spectroscopy and imaging, Electrochem. Commun. 30, 5–9 (2013). doi: http://dx.doi.org/10.1016/j.elecom.2013.01.021
- G. Li, V. Shrotriya, Y. Yao, J. Huang and Y. Yang, “Manipulating regioregular poly(3-hexylthiophene) : [6,6]-phenyl-C61-butyric acid methyl ester blends—route towards high efficiency polymer solar cells”, J. Mater. Chem. 17, 3126–3140 (2007). doi: http://dx.doi.org/10.1039/b703075b
- M. Lo, C. Marcott, R. Shetty and K. Kjoller, “Nanoscale infrared spectroscopy of organic photovoltaic materials”, Proceedings of PMSE 178–179 (2011).
- C. Marcott, M. Lo, K. Kjoller, C. Prater and D.P. Gerrard, “Applications of AFM-IR—Diverse analyses at nanoscale spatial resolution”, Microsc. Today 20(4), 16–21 (2012). doi: http://dx.doi.org/10.1017/S1551929512000776