Carsten Kötting and Klaus Gerwert
Lehrstuhl für Biophysik, Ruhr-Universität Bochum, 44780 Bochum, Germany. E-mail: [email protected], [email protected]
In the post-genome era, the focus of life science is shifting to proteins. Based on the difference between the various states of the protein, time resolved Fourier transform (tr-FT-IR) spectroscopy can selectively detect, with nanosecond resolution, reactions of the amino acids, the ligands and specific water molecules in the active centre of the protein, thereby providing a detailed understanding of the reaction mechanism. Malfunctioning of proteins is the cause of many diseases. Thus, the understanding of structure, function and interaction of proteins at the molecular level is essential for the development of drugs for a rational molecular therapy.
The three-dimensional structure of proteins can be determined by nuclear magnetic resonance spectroscopy or X-ray crystallography. The determination of the structure is always a milestone on the path to understanding a protein’s function. However, usually only the structure of the ground state is obtained. Tr-FT-IR spectroscopy is an excellent complement to these methods; information on charge distribution, hydrogen bonding and protonation states can be obtained.1–5 This gives direct insights into the reaction mechanism at the atomic level.
Absorption spectrum of a protein
In Figure 1 a typical absorption spectrum of a protein dissolved in water is shown. Due to the multitude of absorptions, it is impossible to identify absorptions of individual groups. The predominant absorptions are those of the amide-I band (sum of all C=O backbone stretching vibrations), the amide-II band (sum of all NH bending and CN stretching vibrations of the backbone) and the OH-bending vibration of water.
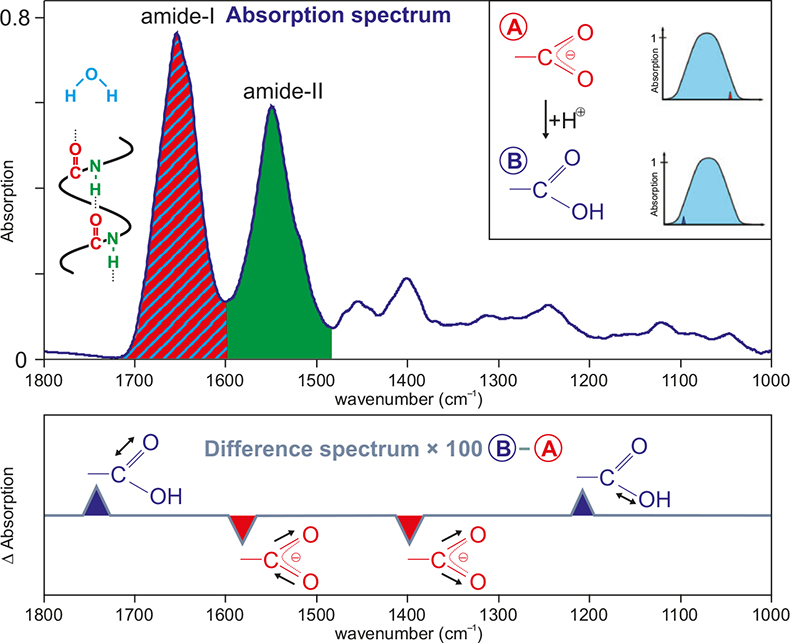
Figure 1. Typical absorption spectrum of a protein solution (here 10 mM Ras). The main components are indicated by the colours red (C=O stretching vibration, amide I), blue (bending vibration, water) and green (combination of NH bending and CN stretching vibration, amide II). In the inset, two absorption spectra of a protein, which deviate only in the protonation of a carboxyl group, are shown schematically. In the lower part, a difference spectrum of these two states is shown schematically. The background absorptions of the unchanged part of the protein are cancelled out; the absorptions of the reacting group are now resolved.
Difference spectroscopy
To obtain information on individual groups, we have to examine difference spectra. In the simple case of a reaction A → B, one calculates the difference of the absorption spectra of the two states (B – A). The background absorption of the protein is about 103 times greater than the absorption of the reacting groups. Thus it is very important to keep the measurement conditions exactly the same throughout. This includes using an air-conditioned room and a vibrationally isolated table, and the sample has to remain within the spectrometer all the time. Thus, the reaction has to be started (triggered) within the spectrometer. For photobiologically active proteins a laser flash can do this. In other cases photolabile caged-compounds, which release a biologically active substance after irradiation, can be employed. Furthermore, micro-mixing cells allow mixing of two reactants within the sub-millisecond time regime. With the ATR (attenuated total reflection) technique it is possible to immobilise a protein on a surface and study reactions with ligands or other proteins.6
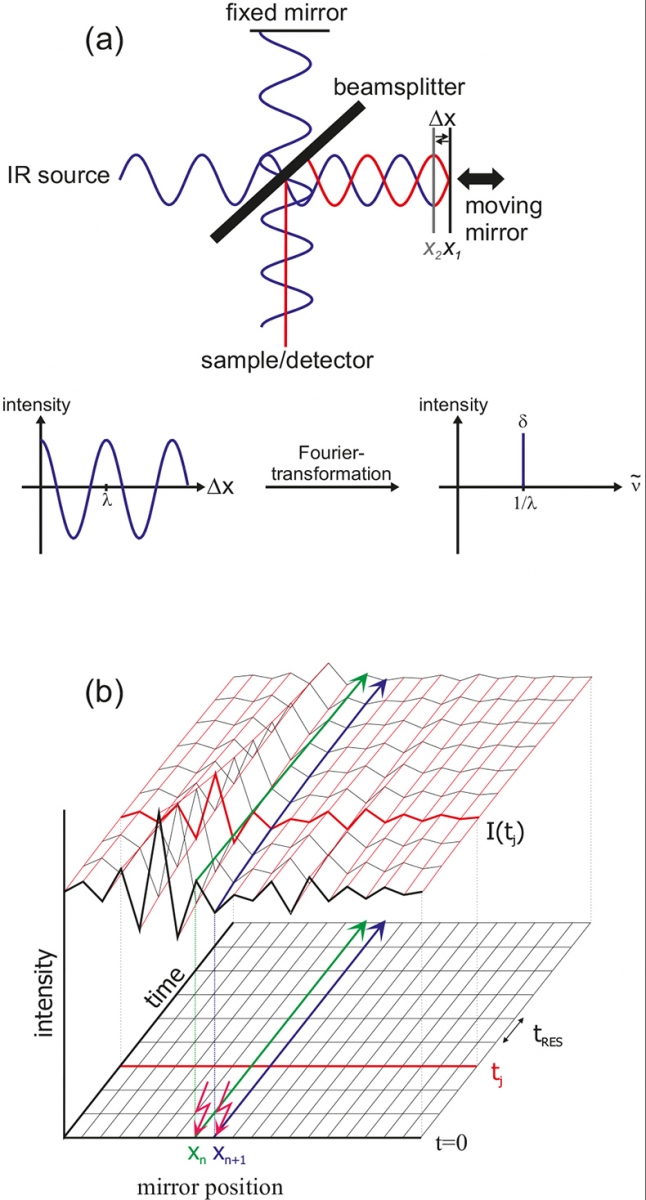
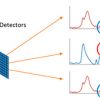
Figure 2. Basic principle of FT-IR.
Basic principle of tr-FT-IR
The central element of an FT-IR spectrometer is the Michelson interferometer. All wavelengths of the IR source are measured simultaneously. In Figure 2 the principle is exemplified using a monochromatic source. After the beam-splitter, one beam is reflected by a stationary mirror and the other beam by a moving mirror. The differences in path-length give wavelength-dependent interferences. For mirror position X1, a difference in pathlength Δx of λ / 2 results after recombination and thus both waves interfere destructively (red). For the same wavelength, but mirror position X2, a path difference of nλ (here n = 0) results, thus leading to constructive interference. The result of the measurement is an interferogram, where the intensity is plotted against the mirror position. After Fourier transformation according to
\[{\sf I\left( {\tilde \nu } \right) = \int\limits_{ - \infty }^\infty {I\left( {\Delta x} \right)} \cos \left( {2\pi \tilde \nu \Delta x} \right)dx }\]
a single channel, spectrum I(\({\sf {\tilde \nu } }\)) is obtained. Here, \({\sf {\tilde \nu } }\) is the inverse wavelength 1/λ. For our monochromatic example the δ function is achieved. The difference spectra as shown in Figures 3 and 4 are calculated by two single channel spectra according to log[I1(ν)/I2(ν)].
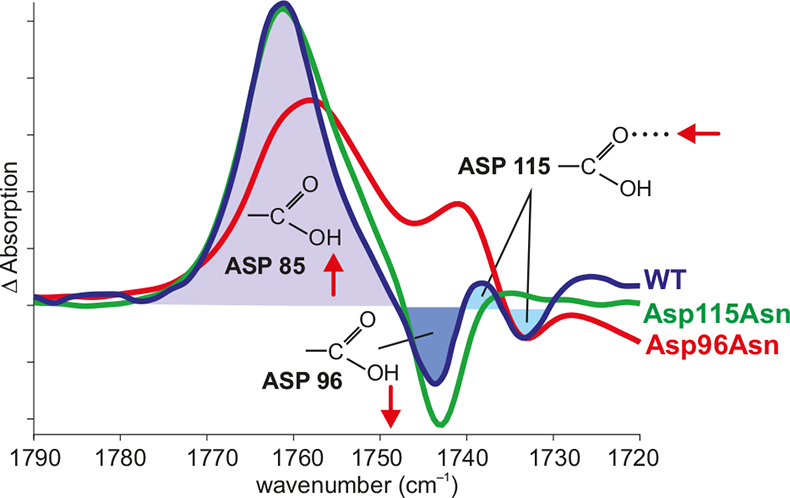
Figure 3. Band assignment by site-directed mutagenesis. In the difference spectrum N – BR of the wild type (WT) (blue), the positive band shows the protonation of Asp85, the negative band shows the deprotonation of Asp96 and the difference band shows the change in the hydrogen bonding of Asp115. The negative band of Asp96 vanishes in the Asp96Asn mutant (red). The difference band of Asp115 vanishes in the Asp115Asn mutant (green).
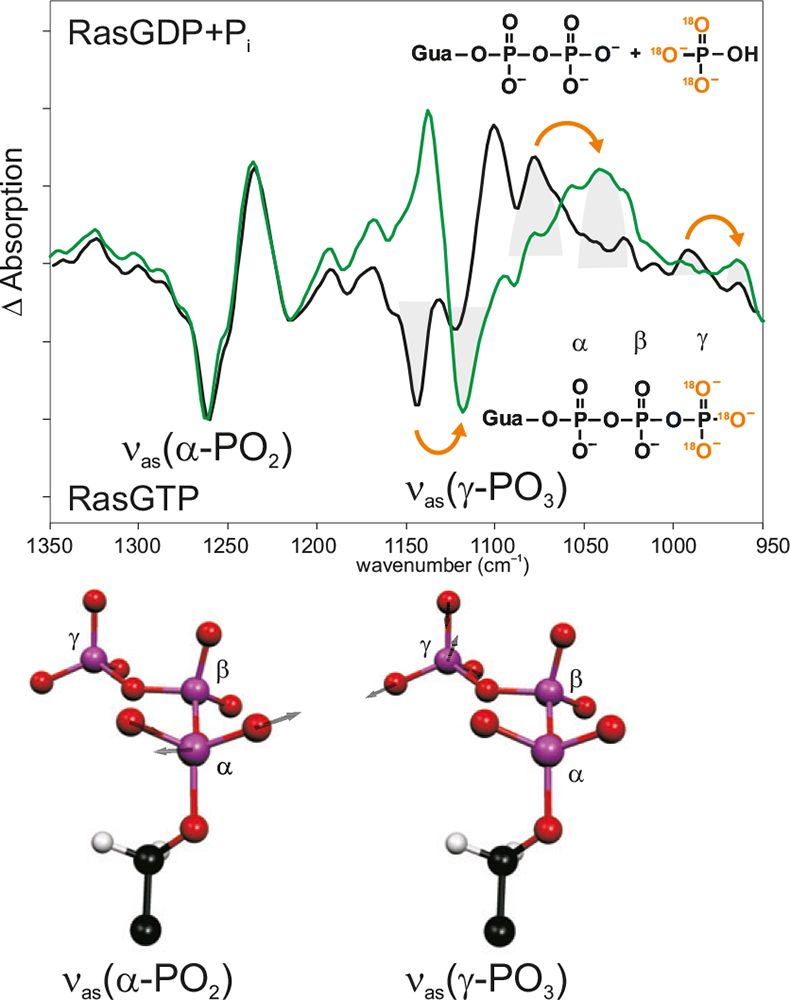
Figure 4. Band assignment by isotopic labelling. In the hydrolysis spectrum of Ras, the bands pointing downwards are from the Ras·GTP state; the bands pointing upwards are from the Ras·GDP state. Black: unlabelled; green: γ-18O3-GTP. Due to the labelling, the absorption of the νas(γ-PO3)-vibration has shifted, whereas the other bands, e.g. the absorption of the νas(γ-PO2)-vibration are unchanged. Below, the calculated normal modes are shown.
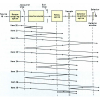
In the rapid-scan mode, the mirror is moved very fast. Complete interferograms I(tj) are obtained within a few milliseconds (tres).7,8 A time resolution of about 10 ms for spectra from 1800 to 900 cm–1 with 4 cm–1 spectral resolution can be obtained. In the step-scan mode,9,10 the mirror is fixed in position Xn and time-dependent IR intensities are measured [green line in Figure 2(b)]. Then the mirror is moved to the next position Xn + 1 and the experiment is repeated under exactly the same conditions (blue line). After measuring all positions, the data can be rearranged to yield interferograms I(tj) for each time slice. The time resolution is limited by the rising time of the detector, typically about 20 ns using liquid N2 cooled mercury-cadmium-tellurium (MCT) detectors. By means of femtosecond lasers the resolution can be further enhanced.
Band assignment
In order to derive information on the reaction, the IR bands have to be assigned to molecular groups of the protein. If structural models of the proteins are available, in addition spatially-resolved information is gained. One method is site-specific mutagenesis. Here, the bands of the mutated amino acid are missing compared to the wild type (Figure 3).11
Another option is isotopic labelling of an amino acid or a ligand, leading to a shift of the absorption in the spectrum (Figure 4).12 Since a mutation can be invasive, isotopic labelling should be preferred wherever possible. Once a band is assigned, very accurate information on interactions of this group, on protonation states, charge distribution, involvements in the reaction mechanisms and bond orders can be obtained.
Theoretical infrared spectroscopy
The QM/MM (quantum mechanics/ molecular mechanics) approach13,14 can be used to calculate the IR spectra of proteins. Because proteins are far too big to be completely quantum chemically treated, the main part of the protein and its water surrounding are classically calculated using an empirical force field at a lower computational level, but the active centre or a prosthetic group bound to the protein is treated by high-level quantum mechanical methods, mostly density functional theory (DFT). The QM/MM calculations provide the frequency, the band-width and the intensity of infrared absorptions, which can be compared with experimentally observed spectra. If the vibrational spectrum is accurately reproduced, the results obtained from the calculation will be reliable, thus more details, e.g., the geometry, the electron density and the charge distribution of the QM-treated protein part, can be derived from the IR spectrum. These are the key parameters for determining the molecular mechanism of a protein.
How proteins pump protons
Tr-FT-IR difference spectroscopy was established in investigations of the light-driven proton pump bacteriorhodopsin (bR) (Figure 5). The key processes of the pump, proton-transfer from the Schiff base to Asp85 and reprotonation of Asp96 were discovered by tr-FT-IR. These findings were confirmed by the X-ray structures.11
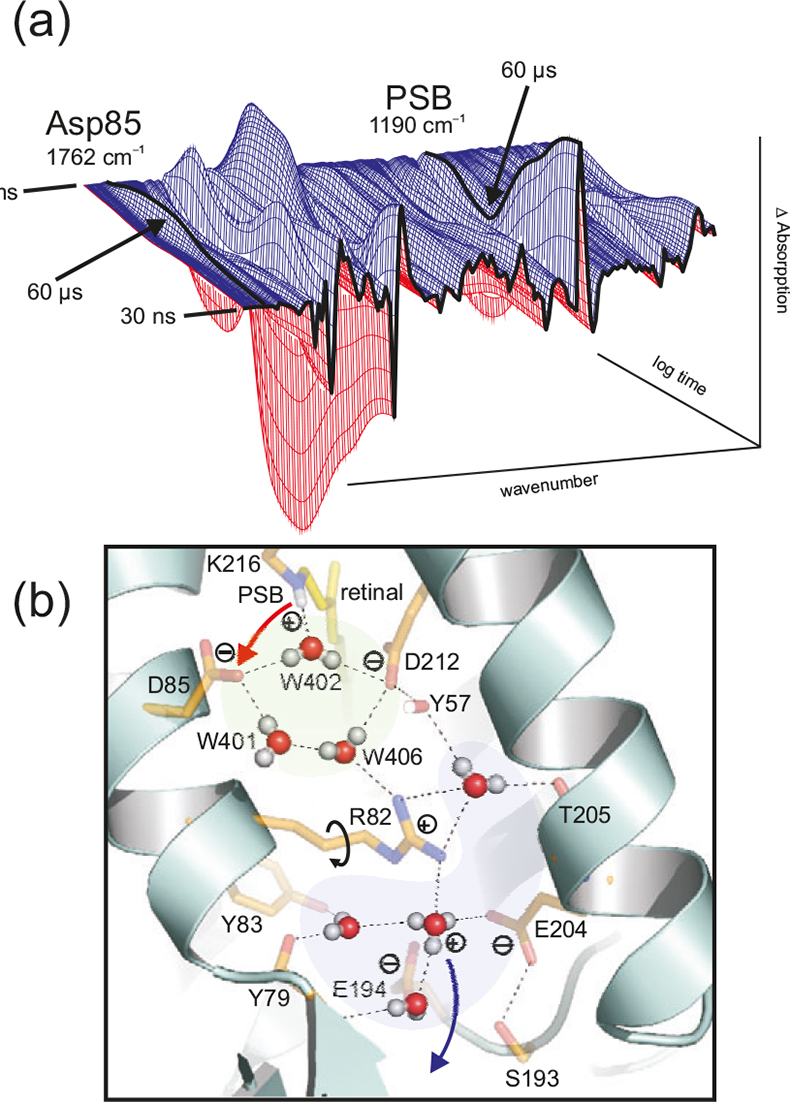
Figure 5. (a) Time dependent absorption changes during the bR photocycle from 30 ns to 200 ms at 4 cm–1 resolution. The absorption of protonated Asp85 (1762 cm–1) and protonated Schiff base (PSB) (1190 cm–1) are labelled. In the L → M reaction (completed after 60 μs), a proton is transferred from the PSB to Asp85, as seen in the decay at 1190 cm–1 and the increase at 1762 cm–1. (b) Due to light-induced isomerisation of the chromophor retinal, the strong H-bond of water 402 is broken and approximately half of the energy is stored in the protein. After isomerisation, the free OH-group of the dangling water 401 is H-bonded and can no longer stabilise the charge of Asp85. The proton is transferred from the PSB to Asp85. Due to the neutralisation of Asp85, a movement of Arg82 is induced. This movement of the positive charge destabilises the protonated water complex near the protein surface. The protonated water cluster (blue) stores a proton, probably in an Eigen-complex [H+(H2O)3]. In contrast to the random Grotthuss-proton transfer in water, in the protein the water complex is deprotonated by a directed movement of Arg82. The proton is stabilised in the second hydration shell by amino acids instead of water molecules. Note that in this figure the one-letter code is used for the labelling of the amino acids (e.g. D = Asp, R= Arg).
Biological water
Protein bound water molecules are increasingly found in protein structures. We used bR as a model system to investigate the role of these waters.15 These water molecules are directly involved in the proton transport (Figure 5) and are not just passive elements within the protein. The water molecules are as functional as the amide side chains. This is a paradigm shift. We postulate that water molecules play a key functional role in many proteins. In the X-ray structures the hydrogen atoms are usually not resolved. Thus the information on the functional water clusters is very incomplete. Tr-FT-IR can resolve the protons and the hydrogen bonds and thus resolve the function of these clusters. In addition to the time-resolved measurements, H/D exchange measurements can be undertaken in order to obtain a difference spectrum of all water molecules and the acid groups in a distinct protein state.16
Switching mechanism of GTPases
The Ras-protein is a molecular switch that controls the signal for cell growth. In oncogenic mutations of Ras, which are found in 30% of human tumours, the signal cannot be switched off. We could monitor hydrolysis of the nucleotide GTP of Ras towards GDP, which stops the growth signal.17 Here we use caged-GTP (caged = para-hydroxyphenacyl- or ortho-nitrophenylethyl-), which is already protein bound but which cannot be hydrolysed. After laser irradiation, GTP is formed and the reaction can be observed. Comparing GTP in Ras and in water, we found an unusual charge shift towards β-phosphate, which turned out to be an important factor for catalysis. The decrease of the activation free energy from 28 kcal mol–1 in water to 22 kcal mol–1 in Ras is mainly due to a decrease of the activation enthalpy by more than 5 kcal mol–1.18
Figure 6(a) shows the time course of the absorptions of marker bands. Whereas in the intrinsic hydrolysis (blue) the decrease of the Ras·GTP bands is synchronous with the increase of the Ras·GDP bands, in the 105 faster Ras·RasGAP systems (red) an intermediate appears (green).19 Only after its decay are the end products GDP and free phosphate formed. The intermediate [Figure 6(b)] was shown to be non-covalently protein bound H2PO4–.20 This intermediate can either react back to GTP or can be released from the protein. In a eukaryotic cell, about 150 GTPases with a similar reaction mechanism are found.
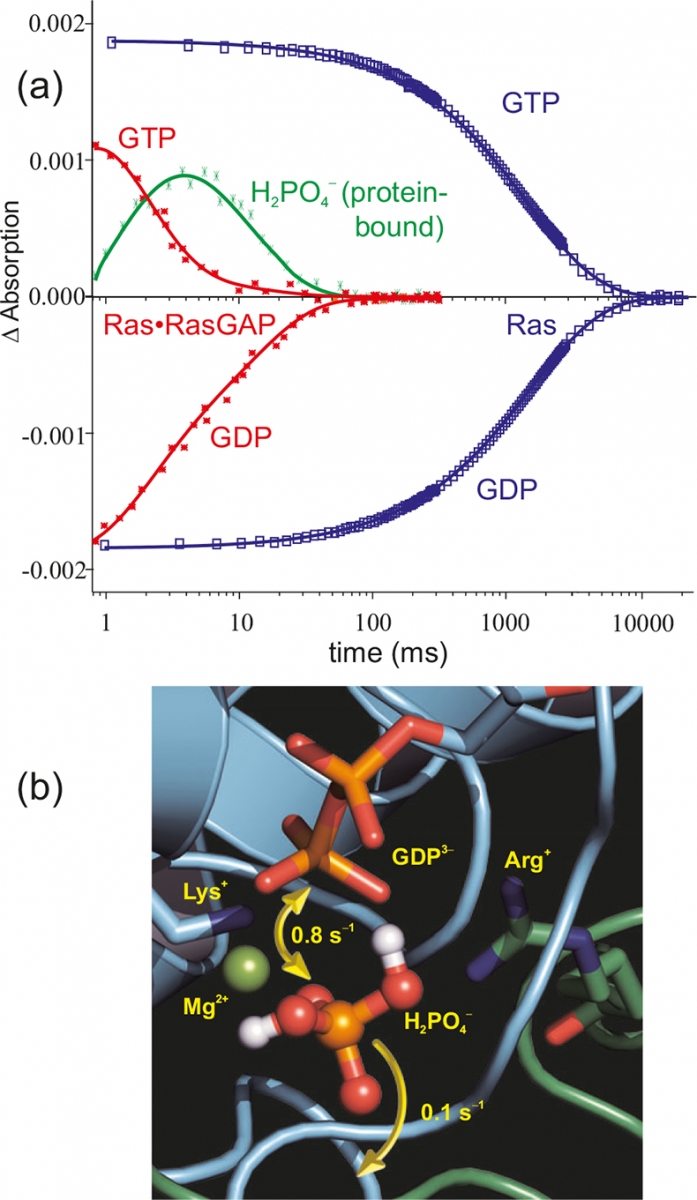
Figure 6. (a) Time-resolved absorption changes of selected marker bands of the GTPase reaction of Ras (blue) and Ras·RasGAP (red). The protein–protein interaction accelerates the reaction by a factor of 105. Furthermore, for Ras·RasGAP an intermediate is observed (green). The structure of the intermediate as derived from tr-FT-IR measurements is shown in (b).20
Drug development
Practically all molecules are visible in the infrared. Thus FT-IR spectroscopy can be universally used in pharma screening. In contrast to most other assays, this method is label-free and does not use an artificial marker that could distort the drug–protein interaction. For example, the surface change of Ras which enables effector binding can be resolved by tr-FT-IR.21
References
- F. Siebert, W. Maentele and K. Gerwert, Eur. J. Biochem. 136, 119 (1983). https://doi.org/10.1111/j.1432-1033.1983.tb07714.x
- M.G. Friedrich, F. Giess, R. Naumann, W. Knoll, K. Ataka, J. Heberle, J. Hrabakova, D.H. Murgida and P. Hildebrandt, Chem. Comm. 2376 (2004).
- C. Kötting and K. Gerwert, ChemPhysChem 6, 881 (2005). https://doi.org/10.1002/cphc.200400504
- S. Luedeke, M. Beck, E.C.Y. Yan, T.P. Sakmar, F. Siebert and R. Vogel, J. Molec. Biol. 353, 345 (2005). https://doi.org/10.1016/j.jmb.2005.08.039
- S. Bernad and W. Maentele, Anal. Biochem. 351, 214 (2006). https://doi.org/10.1016/j.ab.2005.12.024
- K. Ataka and J. Heberle, J. Amer. Chem. Soc. 125, 4986 (2003). https://doi.org/10.1021/ja0346532
- K. Gerwert, Ber. Bunsen-Gesellschaft 92, 978 (1988). https://doi.org/10.1002/bbpc.198800244
- K. Gerwert, G. Souvignier and B. Hess, Proc. Natl Acad. Sci. USA 87, 9774 (1990). https://doi.org/10.1073/pnas.87.24.9774
- W. Uhmann, A. Becker, C. Taran and F. Siebert, Appl. Spectrosc. 45, 390 (1991). https://doi.org/10.1366/0003702914337128
- R. Rammelsberg, B. Hessling, H. Chorongiewski and K. Gerwert, Appl. Spectrosc. 51, 558 (1997). https://doi.org/10.1366/0003702971940585
- K. Gerwert, B. Hess, J. Soppa and D. Oesterhelt, Proc. Natl Acad. Sci. USA 86, 4943 (1989). https://doi.org/10.1073/pnas.86.13.4943
- C. Allin and K. Gerwert, Biochem. 40, 3037 (2001). https://doi.org/10.1021/bi0017024
- M. Klaehn, G. Mathias, C. Koetting, M. Nonella, J. Schlitter, K. Gerwert and P. Tavan, J. Phys. Chem. A 108, 6186 (2004). https://doi.org/10.1021/jp048617g
- M. Klaehn, J. Schlitter and K. Gerwert, Biophys. J. 88, 3829 (2005). https://doi.org/10.1529/biophysj.104.058644
- F. Garczarek and K. Gerwert, Nature 439, 109 (2006). https://doi.org/10.1038/nature04231
- F. Garczarek and K. Gerwert, J. Amer. Chem. Soc. 128, 28 (2006). https://doi.org/10.1021/ja056488r
- V. Cepus, A.J. Scheidig, R.S. Goody and K. Gerwert, Biochem. 37, 10263 (1998). https://doi.org/10.1021/bi973183j
- C. Kötting and K. Gerwert, Chem. Phys. 307, 227 (2004). https://doi.org/10.1016/j.chemphys.2004.06.051
- C. Allin, M.R. Ahmadian, A. Wittinghofer and K. Gerwert, Proc. Natl Acad. Sci. USA 98, 7754 (2001). https://doi.org/10.1073/pnas.131549798
- C. Kötting, M. Blessenohl, Y. Suveyzdis, R. Goody, A. Wittinghofer and K. Gerwert, Proc. Natl Acad. Sci. USA 103, 13911 (2006). https://doi.org/10.1073/pnas.0604128103
- C. Kötting, A. Kallenbach, Y. Suveyzdis, C. Eichholz and K. Gerwert, ChemBioChem 8, 781 (2007). https://doi.org/10.1002/cbic.200600552