Jean-Philippe Echarda and Loïc Bertrandb
aLaboratoire de recherche et de restauration, Musée de la musique, Cité de la musique, 221 avenue Jean Jaurès, 75019 Paris, France. E-mail: [email protected]
bIPANEMA, synchrotron SOLEIL, Saint-Aubin, 91192 Gif-sur-Yvette cedex, France
Introduction
For the past two centuries, the nature of the varnishes coating historical instruments has been a much debated subject. Focusing in particular on the varnishes used for coating violins made by the Italian instrument-maker Antonio Stradivari, numerous hypotheses have been raised by instrument-makers, experts, musicians and chemists, without reaching a general understanding of the ancient varnishing techniques. A few years ago, we decided to work on this topic using several complementary approaches for materials characterisation and study of historical sources (ancient varnish recipes, etc.).
In fact, the research and conservation laboratory of the Musée de la musique in Paris aims to study the musical instruments from its collection in order to:
- define optimal conservation conditions
- study the ageing of materials in various contexts, in particular when instruments are being exhibited or have been played by musicians
- obtain a better understanding of the ancient instruments-making techniques, which are not fully described.
A varnish is basically considered to be one or several layer(s) of organic film-making substances, a few tenths of micrometres thick, coated onto a surface. These layers may contain mineral particles. The organic compounds are natural products such as oils, tree resins and gums, insect resins, dyes, proteinaceous materials, either used alone or mixed together, possibly purified, pre-treated or diluted in a volatile solvent. Inorganic compounds—present as oxides, hydroxides, carbonates, etc.—may be added as pigments, fillers, driers or lake substrates. Instrument makers usually distinguish between spirit varnishes (resins dissolved in alcohol), essential oil varnishes (resins dissolved in volatile oils) and oil varnishes (resins mixed with siccative oils).
On a centuries-old instrument, having been played, handled, cleaned and repaired, the varnish has been altered by chemical and mechanical ageing and wear heterogeneously on the different parts of the instrument, increasing both the complexity of the varnish composition and its analysis. Furthermore, only very limited micro-sampling of the varnishes are allowed on rare and ancient instruments.
From the 1950s on, analytical chemistry opened up the way for the study of ancient musical instrument varnishes (mostly undertaken on Italian violins). The limited set of available micro-analytical techniques led to a partial description and understanding of the complex compositions and stratigraphies.1
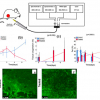
It appeared to us that it was necessary to define an analytical methodology dedicated to the most complete characterisation of ancient varnishes coating musical instruments. In order to maximise the quantity of information obtained (concerning both the organic and mineral compositions in their stratigraphy), we used a sequence of analytical techniques adapted to the scale of the layer thickness and to the available material quantity for analyses (see Figure 1). This sequence includes several spectroscopic techniques which have been applied in the past decades in the fields of ancient material sciences (conservation of cultural heritage artifacts, archaeometry), Earth and environmental sciences. Of particular interest to us are the developments of techniques that enable one to perform in situ analyses (and, thus, require no sampling), or the coupling of microscopes to spectrometers. Some recent examples of the use of spectroscopic techniques in our analytical methodology are briefly covered below.

In situ energy dispersive X-ray fluorescence spectrometry
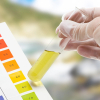
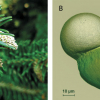
Although musical instruments varnishes look transparent at the macroscopic scale, we have observed mineral pigment particles in low concentration on some instrument varnishes, using in situ light microscopy [see Figure 2(a)]. Using in situ energy dispersive X-ray fluorescence spectrometry (EDXRF) [(see Figure 2(b)] we have identified artists’ pigments containing heavy elements such as vermillion (HgS), from the Hg L-lines associated with the presence of the red particles, and orpiment (As2S3), due to an As and S XRF signal associated with yellow particles.2 Such use of the EDXRF technique is widespread among museum laboratories. Less obvious applications of in situ EDXRF are the detection of lead in varnishes or the tracking of sweat impregnation. Lead compounds such as litharge (PbO) have, in some cases, been admixed to varnishes containing siccative oils, in order to speed up their otherwise long curing and drying times. In such cases, lead may be present in very low concentration, requiring long EDXRF data acquisition times (up to 500 s, Mo anticathode, 50 kV, 600 µA, 0.6 mm pinhole, in air).
 Vermillion (HgS) grains in the varnish of the “Sarasate” violin (A. Stradivari, 1724) observed using light microscopy and (b) being characterised by in situ EDXRF.")
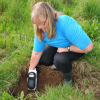
Among cultural heritage artifacts, musical instruments are specific because they have often been played and handled. For instance, violin soundboards are exposed to sweat drops falling from places such as the violinist’s forehead, chin or hands. We have discovered that it was possible to trace mineral elements from sweat (for example, Cl, K, Cu, Zn–Na is too light to be detected by our EDXRF system) impregnating the instruments. In particular, we have evidence that the wood may be contaminated by salt from these elements in areas where the varnish is worn out, such as where the chin rests (see Figure 3).3 This characterisation is of particular importance for conservation purposes, since the thin wood soundboard may be more sensitive to humidity changes in these areas.
 intensity along a linescan between A and B points (the “Provigny” violin, A. Stradivari, 1716). The highest chlorine signals are found on areas where the varnish is worn and where sweat has impregnated the wood.")
(Synchrotron-based) micro-Fourier transform infrared spectroscopy
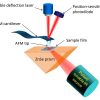
Varnish layers may only be a few micrometres thick. In order to analyse the specific composition of each of these layers, we have analysed micro-samples cut in cross section using synchrotron radiation-based micro-Fourier transform infrared (SR-FT-IR) spectroscopy. Microtomed thin slices (1–5 µm) have been analysed in transmission mode or transflection mode (a reflection–absorption method from a sample deposited onto a reflective slide, whereby the spectrum generated is nearly equivalent to that of a transmission spectrum from a sample of twice the thickness). The IR source radiation emanating from a synchrotron, being of low divergence and, therefore, very bright, means the analysis spot size can be as small as ca 6 µm—a dimension imposed by the diffraction limit—which is usually small enough to characterise a single layer. Thus, we have been able to characterise a protein-based layer and the mineral particles admixed to it in a varnish cross-section (performed on the infrared micro-spectroscopy instrument at the ID21 beamline, ESRF, Grenoble).4
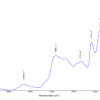
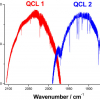
We have also been able to analyse the two layers of varnish on a set of instruments made by Antonio Stradivari (performed at the SMIS infrared beamline, which houses two infrared micro-spectroscopy instruments, SOLEIL synchrotron, Saint-Aubin). The FT-IR spectra recorded show little difference and are both typical of oil-based media: absorption bands associated with the O–H, C–H and C=O stretches dominate the spectrum (Figure 4). The shoulder around 2958 cm–1 is characteristic of the CH3 antisymmetric stretch of long aliphatic chains. For the lower varnish layer, the rather broad (C=O) band is centred between 1725 cm–1 and 171 cm–1. These features can be interpreted as those of a partially oxidised and hydrolysed drying oil. As for the upper layer, we observed a greater variability in position of the (C=O) band, with a maximum ranging between 1730 cm–1 and 169 cm–1. We ascribed bands in the range 1730–1710 cm–1 to degradation products of the original triglycerides, while bands below 1710 cm–1 suggest the presence of resinous acids in the upper layer. Subsequent pyrolysis gas chromatography-mass spectrometry (Py-GC/MS) analyses confirmed these results, indicating, in addition, that the resin used in the upper layer was diterpenic, an exudate of a Pinaceae spp. tree, i.e. “Pinus resin”.5,6
, surface stratum (tinted).")
Among all the possible ingredients that had been mentioned in the extensive published literature about Stradivari’s varnish, we have been able to rule out protein materials—such as egg, casein or animal glue—as significant ingredients by the absence of observation in the infrared spectrum of amide-I and amide-II bands around 1650 cm–1 and 1550 cm–1, respectively. Similarly, neither the (C–O–C) band around 1040 cm–1 nor the sharp doublet at 1470 cm–1/1460 cm–1 due to CH2/CH3 bending modes, respectively characteristic of gums and waxes, were observed.
Micro-Raman spectrometry
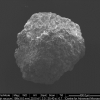
In the case of varnishes from three Stradivari instruments, neither in situ EDXRF nor scanning electron microscopy/EDX spectroscopy (SEM/EDX) on micro-samples were able to precisely answer the nature of the two types of red pigments observed. EDX spot analyses of specific grains showed that the first type was Fe-rich, possibly indicating an iron oxide. The second type was Al- and O-rich, indicating that an aluminium compound was the substrate of a red organic dye. Only by using micro-Raman spectrometry, with a spatial resolution close to 2 µm (using 45 nm and 514.5 nm excitation wavelengths, 30 µW power at the sample, spectral resolution of ca 3 cm–1 at 1000 cm–1, performed at LADIR (Laboratoire de Dynamique, Interactions et Reactivité at the Institute of Chemical Sciences in Vitry-Thiais), focusing on individual particles, have we been able to find evidence for haematite and magnetite phases in the iron oxides and that the red dye was an anthraquinone, probably carminic acid.5,6 This latter identification has been more difficult, since the Raman spectrum of the molecule could be modified by its environment, in particular by the mineral substrate and the oil-based binding medium (see Figure 5). Such analytical results can be interpreted using historical knowledge of material trades and practical knowledge of pigments’ preparation: on the studied instruments, Stradivari used a mixture of quite pure or refined ochre (containing haematite) and cochineal lake pigments (carminic acid on an alumina substrate) to give a red tint to these instruments.
 a red particle in a Stradivari varnish and of anthraquinonic reference substances: (2) carminic acid, (3) alizarin and (4) purpurin, all recorded with a 458 nm excitation laser and baseline subtracted. Differences in the relative band intensities between (1) and (2) could be due to the dye interaction with aluminium or the surrounding medium.")
Microspectrofluorimetry
Another characteristic of these ancient varnishes is that they often fluoresce under UV/visible excitation. The fluorescence contrast of the varnishes has been used for a long time to examine the retouches and wear areas of violin varnishes under a Wood’s lamp. Microspectrofluorimetry seems to be a promising technique to discriminate between various classes of varnish binding media, even if their spectral features are not very sharp.7 Emission spectra obtained from various 4 µm spots of a cross-section from a 16th century lute varnish illustrate the variability in spectral properties of the different layers (see Figure 6, analysis performed at the National Gallery of Art, Washington DC, USA).
 the polymer resin embedding the varnish cross-section, (B) and (C) two different layers of the varnish stratigraphy (lute, L. Maler, before 1552) (405 nm Hg band excitation, 4 µm spot size, spectra normalised in intensity).")
Conclusions
Spectroscopic techniques are key techniques in the characterisation and understanding of the composition and structure of varnishes of historical musical instruments. The multiple analytical issues of this project have been addressed by using a combination of complementary analytical techniques. We are currently exploring further developments including the study of fluorescence lifetime measurements7 and FT-Raman spectrometry8 of organic varnish materials and testing more in situ instrumentations.
Acknowledgements
The authors wish to thank all the co-authors of the articles summarised in the current article, the Science Research Department (National Gallery of Art, Washington DC, USA), the SMIS beamline (SOLEIL synchrotron) and the MOLAB programme (Eu-Artech/CHARISMA).
References
- J.-P. Echard and B. Lavédrine, J. Cult. Herit. 9, 420 (2008).
- J.-P. Echard, Spectrochim. Acta B 59, 1663 (2004).
- J. Muller, J.-P. Echard, S. Le Conte and S. Vaiedelich, in De la peinture de chevalet à l’instrument de musique: vernis, liants et couleurs. Cité de la musique, Paris, France, p. 102 (2008).
- J.-P. Echard, M. Cotte, E. Dooryhee and L. Bertrand, Appl. Phys. A 92, 77 (2008).
- J.-P. Echard, L. Bertrand, A. von Bohlen, A.-S. Le Hô, C. Paris, L. Bellot-Gurlet, B. Soulier, A. Lattuati-Derieux, S. Thao, L. Robinet, B. Lavédrine and S. Vaiedelich, Angew. Chem. Int. Ed. 49, 197 (2010).
- J.-P. Echard, L. Bertrand, A. von Bohlen, A.-S. Le Hô, C. Paris, L. Bellot-Gurlet, B. Soulier, A. Lattuati-Derieux, S. Thao, L. Robinet, B. Lavédrine and S. Vaiedelich, Angew. Chem. 122, 202 (2010).
- A. Nevin, J.-P. Echard, M. Thoury, D. Comelli, G. Valentini and R. Cubeddu, Talanta 80, 286 (2009).
- C. Daher, C. Paris, A.-S. Le Hô, L. Bellot-Gurlet and J.-P. Echard, J. Raman Spectrosc., in press (2010).