Shou-He Yan
Université catholique de Louvain (UCL), Unité de Biochimie de la Nutrition (BNUT), Croix du Sud 2/8, 1348 Louvain-La-Neuve, Belgium. E-mail: [email protected]
Introduction
Green, Black and Oolong tea are three principal types of tea. They are produced from the leaves of young shoots of the plant Camellia sinensis. The procedure for producing Green tea, only by drying the leaves, preserves polyphenols as well as the green colour. The fermentation procedure for producing Black tea transforms the polyphenols into theaflavines, thearubigines etc, resulting in a dark-red colour. The production of Oolong tea, which is a semi-fermented tea, combines the procedures for preparing both Green and Black teas;1 the fermented part is reddish, thus it is called “green leaf with red border”. (See, for example, http://www.hku.hk/hkumag/teagallery.html).
The evaluation of tea quality is still dependent on the inspection–judgement of sensory analysts. The quality grades of a tea, judged by its sensory appearance, smell, flavour and taste, decide its market price. The “Chinese tea grading system” is used to judge tea quality;2 this is rigorously enforced by all tea assessment masters in China, with a maximum quality score of 100. Three grams of tea is selected for testing and is infused for 5 minutes with 200 mL boiling water. Up to 10 points are awarded for both the size and shape of the tea leaves before and after infusion; up to 80 points are awarded for the infusion itself: 15, 30 and 35 points for the colour, the flavour and the taste, respectively. The total score represents the intrinsic value of the tea, the higher the score, the better the quality.2 This evaluation allows a classification into about seven categories of quality grade, grade 1 being the highest quality.
The tea quality grade is expressed by using the name of the tea and its grade, for example, Keemun-1 (K1), Keemun-2 (K2). The most frequent tea quality grades range from 1 to 5. The same quality grade of tea from a different origin or of a different type is not comparable. It is meaningless to compare the same grade of Green and Black teas or Keemun and Fengquing teas. This fact restricts the utilisation of this traditional sensory evaluation for the estimation of tea quality, especially on the international market.
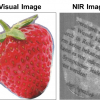
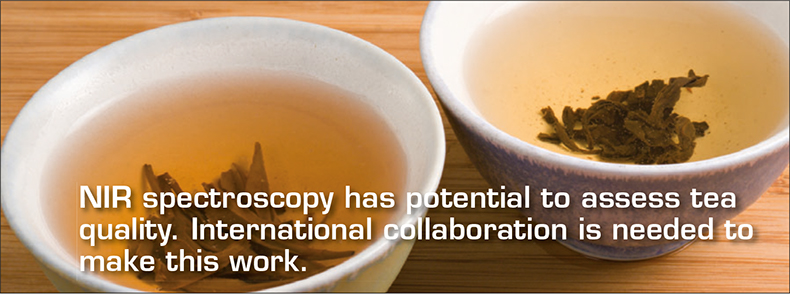
This article will focus on the applicability of near infrared (NIR) spectroscopy as a potential substitute to the sensory evaluation of tea quality. The study indicates that NIR technology could provide an objective, internationally acceptable and rapid method to assess tea quality, thereby allowing an objective assessment between the quality of tea and its market price.
Calibration and prediction
In our study, one set of samples for NIR analysis calibration comprised 24 Green and 24 Black teas that had been chosen from Chinese National Standard (CNS) export teas. These were provided by the “Chinese Assessment and Quality Control Committees” (CAQCC) from samples that had been evaluated by more than 100 tea assessment masters from 19 provinces. The two series used were: Green teas, Chunmee (14) and Hyson (10); Black teas, Keemun (10) and Fengquing (14, Camellia assamica). The Chunmee and Fengquing teas had been variously assigned into grades 1 to 7; the Hyson and Keemun had been variously assigned into grades 1 to 5. The 48 CNS export teas, provided by the Shanghai Tea Science Society, were re-examined by about 20 tea testers, before being sent for NIR calibration study.
A second set of samples for prediction comprised a series of 48 Chinese Provincial Standard (CPS) tea samples, equivalent to the CNS series, but chosen from An-Hui (Camellia sinensis) and Yu-Nan (Camellia assamica) Province tea export Corporations. Each sample was re-examined by about 15 tea testers before being sent by the province for the NIR study.
Reflectance NIR spectra were recorded, over the range 1100–2500 nm, from 6 g of each tea sample after it had been sandwiched between a glass window and a glass fibre filter. Derivative NIR spectra were processed and evaluated using a multiple linear regression (MLR) procedure3 (see Table 1).
Table 1 shows that, as we stated above, the grade categories are not comparable between teas from different origins. In our previous study,3 we showed, that in order to establish a NIR MLR model of tea quality, it is essential first to analyse a tea in terms of its chemical components (polyphenols, caffeine, amino acids, lignin). This was undertaken by established methods, either chemical analysis or UV spectrometry (see Reference 3 for full details). These data were then combined and subjected to a principal component analysis (PCA), the scores distributions from which were used to modify some of the grade input data for the subsequent MLR analysis.3
Table 1. The relationship between tasters’ quality grades and MLR quality indices from calibration (R2) and prediction (r2) based on the 1st or on the 2nd derivative spectra.
MLR quality: | 1st derivative | 2nd derivative | ||
Indices based on | 1* | 2* | 1* | 2* |
R2 (Calibration) | 0.86 | 0.79 | 0.89 | 0.83 |
r2 (Prediction) | 0.81 | 0.72 | 0.86 | 0.68 |
1*: the tasters’ quality grades input data were 1 to 7 for Chunmee and Fengquing; those of Hyson were from 2.5, and 3.5 to 6.5 and those of Keemun were from 3 to 7, respectively. This modification was obtained from using the chemical component (polyphenols, amino acids, caffeine and lignin) analyses as input data, followed by a principal component scores analysis, reported in our earlier study.3
2*: the tasters’ quality grades input data were 1 to 5 for Hyson and Keemun, 1 to 7 for Chunmee and Fengquing, as supplied.
It can be seen from Table 1 that the MLR calibration derived using the 2nd derivative spectra yielded the best results with the correlation (R2) of 0.89 in the calibration set (48 CNS samples) and gave a (r2) of 0.86 in the prediction set (48 CPS samples). For this evaluation, more than 70 % of the teas were classified within a group, in which the MLR quality index differed by less than 0.5 from that designated by tasters. Only 9.7 % of tea samples were misclassified by about 1 grade, while 20.3 % of the teas were classified with divergences of 0.6 to 0.9 from the input grade.3
The 96 (calibration plus prediction sets) tea spectra were then analysed by partial least-squares regression (PLS) using the Unscrambler 5.5 software package (CAMO A/S Trondheim, Norway). The PLS analysis yielded 86 teas (89.6 %) that were correctly evaluated with a divergence smaller than 0.5 of a grade; eight teas (8.3 %) were “doubtful” with a divergence of between 0.5 and 0.8 of a grade, and two teas (2.1 %) were misclassified with a divergence greater than 1 grade. Thus the PLS analysis appeared very promising.3
Evaluation of tea quality by NIR spectroscopy and its market price
Japanese Green teas3
NIR spectra recorded from two series, totalling 18 samples, of Japanese green teas (Sencha and Gyokuro) purchased at market prices from a Tokyo store in 1985 and 1987 were evaluated. The price of the seven Sencha teas ranged from 500 to 2000 yen per 100 g and that of 11 Gyokuro teas ranged from 400 to 5000 yen. Their quality grades, shown in Table 2, were predicted from the best MLR equation developed, see above.
Table 2. The Sencha or Gyokuro tea market prices and their MLR quality values.
MLR prediction quality value | Price (yen) of the tea per 100 g | |||||
500 | 1000 | 1500 | 2000 | 3000 | 4000 | |
Sencha | 2.35 | 1.23 | 0.21 | –1.32 | — | — |
Gyokuro | 4.28 | 2.40 | 2.78 | 1.80 | –0.21 | –0.81 |
aTea samples were purchased after storage for one year.
In Table 2, the Sencha tea quality grade, shown by the increasing MLR quality value, increases with intervals of 1.12, 1.02, 1.11 and 1.53 corresponding to an increase in market price, i.e. with an increase in tea quality. Two Sencha teas (of 10 yen g–1 and 20 yen g–1) kept in storage for one year were predicted to be of lower quality, as shown by the increases in their MLR value of about 1. These variations correspond to the sensory-expertise of tea assessment masters, confirming that fresh teas are always better than old ones.
The MLR quality value of Gyokuro tea, market priced from 1500 to 3000 yen per 100 g, decreased by 0.98 and 1 (2.01/2) with each 500-yen increase, respectively. In other samples of Gyokuro tea, the MLR quality indices were 5.53, 3.65 and 1.3 corresponding to prices of 400, 800 and 5000 yen per 100 g, respectively. This highlights a problem for the Gyokuro in that the highest market priced tea was rated in its quality relatively poorly!3 Analysis by HPLC and NIR and by sensory evaluation by tasters is not necessarily reflected in the market price of a tea.
The negative effect of the storage was also shown for Gyokuro tea; the quality value of tea again increased by about 1 in two samples stored for one year. While one cannot compare quality grades between Sencha and Gyokuro, it can be seen again from Table 2, that with increasing market price there is a decrease in the MLR quality value. Establishing distinct MLR equations for different tea types will be a necessary requirement.
Black teas sold on the German market3
Five India Black teas priced from 6.0 to 9.8 DM per 100 g and two Ceylon Black priced from 3.9 to 4.2 DM, were bought from the same store in Germany in 1991. Eight German tasters, from the Institut für Lebensmittelchemie der Technischen Universität, assigned their tea quality scores from 1 to 9 points, the highest being the best quality. The mean given values were 3, 5 and 7, corresponding to the taste scores of “good”, “very good” and “excellent”. The same samples were used for MLR calibration (Table 3).3
Table 3. Total catechin contents by HPLC and NIR spectroscopy in relation to panel tasting points and NIR MLR quality index value for India and Ceylon Black teas.4
Black teas (marketed in Germany) | Prices (DM/100 g) | Total catechins (g 100 g–1) | Quality points | ||
| HPLC | NIR | Panel | NIR | |
India, Darjeeling 1st flush | 9.8 | 8.16 | 7.39 | 5.63 | 5.39 |
India, Darjeeling 2nd flush | 8.5 | 5.88 | 4.78 | 4.75 | 4.96 |
India, Darjeeling autumnal | 7.5 | 5.52 | 5.36 | 4.88 | 5.25 |
India, Assam leaf | 6.8 | 4.22 | 4.63 | 3.81 | 4.46 |
India, Assam broken | 6.0 | 5.31 | 5.49 | 5.28 | 4.39 |
Ceylon, Uva highland | 4.2 | 12.48 | 12.44 | 7.31 | 7.05 |
Ceylon, low grown | 3.9 | 2.04 | 2.03 | 2.20 | 2.06 |
In Table 3, the prices did not agree with the HPLC catechin contents or German panel evaluation. The Ceylon Uva highland tea has the highest quality of all the samples but the lowest price, and 43% only of the known India Darjeeling 1st flush tea price. Moreover, this Ceylon Uva highland tea is incorrectly priced being only 7 % (0.3 DM) higher than the lowest quality tea Ceylon low grown tea. This flagrant discordance between the market prices and the tea quality reveals an abnormally unbalanced situation in the international market economy. NIR spectroscopy, however, agrees with the values determined by HPLC and awarded by the German Panel.
Perspectives
For acceptance of NIR spectroscopy as a method for assessing tea quality, priority must be given to establishing NIR spectroscopy tea quality methods, which can be accepted by all panel tasters throughout the world. The NIR calibration is based on the fact that the more tender are the buds and leaves, the higher are their content of polyphenols, amino acid, aroma and other components that produce the best tea quality. All panel tasters agree that the tea bud aged 0 is the highest quality and that the quality decreases following the position (age) of leaves from the first (age 1) to the fifth (age 5).
On another hand, since the large leaf tea (C. assamica) and the small leaf tea (C. sinensis) are not of the same quality, a minimum requirement has to be to establish two respective NIR quality calibrations. This goal was approached in our previous experiments.3 The correlation coefficient (r2) between MLR tea quality prediction data and leaf age (from 0 to 5) of the two varieties is 0.96. Moreover, MLR quality values ranged from –8 to 11 for assamica and from –7 to 8 for sinensis.3 Every 100 g of dried buds was found to contain about 4000 or 10,000 fresh buds for large leaf (assamica) and for small leaf (sinensis) tea, respectively. In the sinensis variety, the weight ratio to bud considered as 1, increases to 1.8, 3.6, 7.6 and 10.3 from the 1st to the 4th leaf. Based on the different tenderness of leaves, expressed by proportional weight of bud to leaves, experimental samples of defined proportions of bud and leaves must be analysed to establish NIR calibration calibrations, and verified by NIR prediction, and confirmed by combined chemical and PCA analyses.
It is hoped that an international cooperation in the establishment of NIR quality methods for standardised quality prediction will be initiated by China, where assamica and sinensis are grown, with Japan growing sinensis and India or Ceylon, where assamica are grown. Tea producers, tea sellers and their customers, as well as scientists need to collaborate in evaluating the quality of tea and then relating this to its market prices.
References
- Q. Gu, S.J. Lu and B.Z. Yen, Tea Chemistry, Ed by W.L. Yut. University of Science Technology Publishers, Hei Fei, China, pp. 142–152 and 288–322 (2002).
- Z.P. Shi, “Chinese Tea Assessment Criterion”, in Tea Assessment and Quality Control, Ed by S.J. Lu and T.H. Zhang. Agricultural Publishers, Beijing, China, pp. 138–159 (1979).
- S.H. Yan, “Review: Evaluation of the composition and sensory properties of tea using near infrared spectroscopy and principal component analysis”, J. Near Infrared Spectrosc. 13, 313 (2005). doi: https://doi.org/10.1255/jnirs.562
- D. Zhang, S. Kuhr and U.H. Engelhaedt, “Influence of catechins and theaflavins on the astringent taste of black tea brews”, Z. Lebensmit.-Untersuch., und-Forschung 195, 108 (1992).