Rodolfo J. Romañach,a Rafael Méndeza and Kim H. Esbensenb
aUniversity of Puerto Rico, Mayagüez Campus, Puerto Rico. E-mail: [email protected]; [email protected]
bConsultant, independent researcher, Dr (h.c.), www.kheconsult.com. E-mail: [email protected]
This article provides an overview of how the Theory of Sampling (TOS) is becoming a valuable guide for on-line analysis and monitoring [by near infrared (NIR) and Raman spectroscopy] of pharmaceutical powder mixtures. Inspiration has come from a most unexpected source—the mining and minerals processing industry! The sampling requirements in a gold mine may well seem totally irrelevant for pharmaceutical scientists and technicians. The materials processed in these industries are so unbelievably different that it begs belief—beyond the fact that both industries produce high value products. Historically, TOS was developed within the mining and the minerals extracting/processing industries, “surely” outside of the realm of pharmaceutical applications. However, it turns out that the governing principles and sampling unit operations of TOS applies equally well to pharmaceutical processes as these are, but streams of matter that have a certain heterogeneity (residual heterogeneity) after effective mixing. The issues described in this column show how well TOS is also able to address the powder sampling difficulties that have plagued the pharmaceutical industry for a long time.1–5 In fact TOS is becoming a powerful enabler in this realm.
Background
These difficulties in the pharmaceutical sector have a.o. been reflected in the US Food and Drug Administration’s withdrawal of a draft guidance for blend uniformity and non-approval of a second draft guidance.6,7 The withdrawal of the first draft guidance on blend uniformity in August 2003 coincided with industry-wide discussions on the merits of the Process Analytical Technology (PAT) initiative as a means for designing, monitoring and controlling all pharmaceutical processes.8 The resulting PAT guidance was followed by the cGMPs for the 21st Century (cGMPs, current Good Manufacturing Practices) as an invitation to apply the most advanced science and technology to pharmaceutical production.9 The time was right for a new approach; bringing in TOS as a new type of guide allowed focus on the critical element of representative sampling—an element that had been almost totally lacking before.4,10,11
What happens before spectral acquisition is equally important as analysis!
Sampling vs analysis for moving material streams
NIR or Raman spectrometers used for monitoring a moving material process are not isolated from the process. The spectra obtained critically depend on how the material is handled before or at signal acquisition. If a pharmaceutical blend is segregated before spectral acquisition, the NIR spectrum will be adversely modified because it will not represent a correct volume of the compound composition of the stream. TOS provides a definition of sampling as mass reduction of the lot by selection of a certain subset of operative units (increments) with the purpose—not always fulfilled, unless one knows exactly what is to be done—of obtaining a representative sample. This is only possible when the conditions of sampling correctness and sampling precision are respected). For general TOS information, see References 12–14 and further references herein.
However, here is a point: in the realm of on-line analysis, all steps performed before a spectrum is obtained influence the sampling-and-analysis acquisition. It is not uncommon to see presentations, or published articles, that state that sampling is no longer an issue, in fact claim that sampling is eliminated by using on-line spectroscopy. Nothing could be further from the truth, however, sampling is still very much involved. There is always some sort of sampling taking place before, or when, analysis is taking place, the process analysis case is no exception. These issues are discussed in detail in Esbensen & Paasch-Mortensen.10 An analytical aliquot is either produced through a representative sampling/sub-sampling-sample preparation process (from lot-to-analysis), with the result that the content of the aliquot is analysed; the essential issue here is that the aliquot is placed in the analytical instrument—the analyst is in complete control of the minute analytical volume. Or the spectroscopic signal is acquired, on-line or in-line, through the use of a “flow-through cell”.
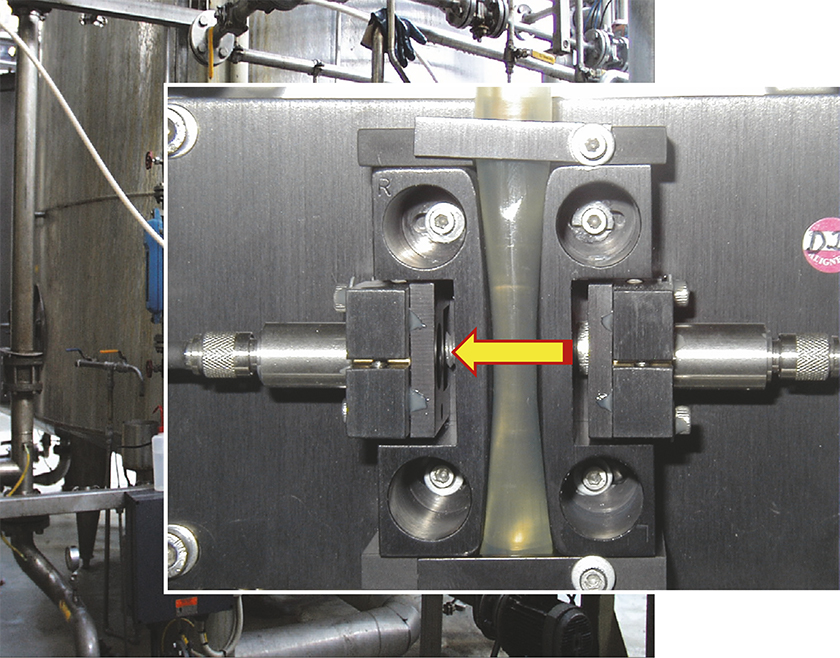
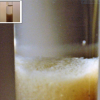
Figure 1. Example of a simple NIR spectroscopy flow-through cell. For fluids and solutions flow-through cells rarely pose problems regarding representativity. The situation is very different for solid mixtures, however. Original photo by Mr Christian B. Zachariassen, reproduced with permission. See C.B. Zachariassen, J. Larsen, F. van den Berg and S.B. Engelsen, “Use of NIR spectroscopy and chemometrics for on-line process monitoring of ammonia in low methoxylated amidated pectin production”, Chemometr. Intell. Lab. Syst. 76, 149–161 (2005), https://doi.org/10.1016/j.chemolab.2004.10.005, for the work behind this photo.
But there is a crucial difference between a sample cell and a sampling cell.
Flow-through cells for aggregate powders a.o.
It is empowering to analyse PAT issues within the context of the Theory of Sampling (TOS). There are a number of potential issues associated with the on-line spectral acquisition mode for flowing powders and other types of aggregate materials15,16 (these will also be the theme for later columns in this series). For now, it suffices to indicate how this relates to the situation of flowing pharmaceutical powders.
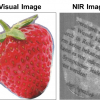
Figure 2 shows a state-of-the-art continuous manufacturing operation, employing flow-through analysis by NIR spectroscopy. This setup, however, has two principal limitations, as all the flowing material does not have an equal opportunity of being sampled/intersected for analysis—due to Increment Delineation Errors (IDE). Material that flows on both sides of the focused NIR beam (panel right) is never analysed. According to TOS, this is a breach of the Fundamental Sampling Principle (FSP). Also, the NIR radiation interacts mostly with the first 1–2 mm of the powder material only, which means that the acquired spectrum is not capable of representing an entire cross-section of the powder blend.10,17,18
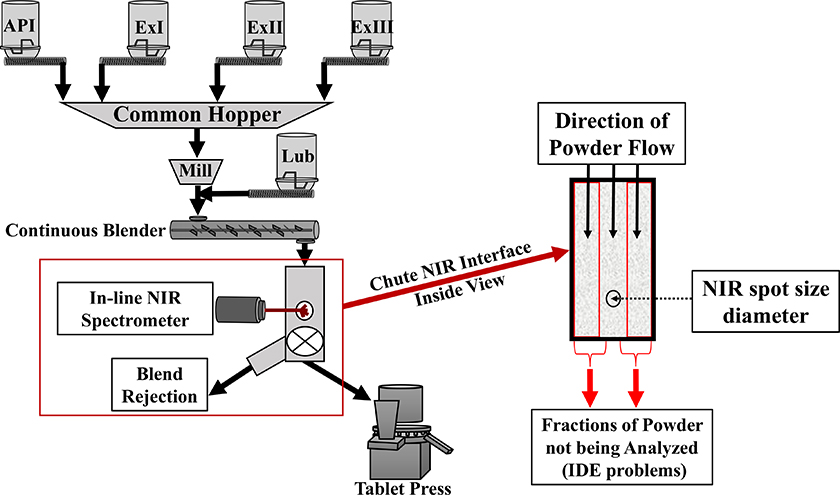
Figure 2. Schematic illustration of principal issues pertaining to on-line NIR process analysis of flowing powders. In the present column we focus on the incomplete analytical volume that is often established using traditional flow-through cells, causing significant IDE and IEE (Increment Delineation and Extraction Errors). TOS analysis of this configuration also reveals that the spectra acquired are only representing the surface of the stream, not a complete across-stream, full depth volume.
Composite sampling (conventional physical sampling)
Pharmaceutical blends will always have some degree of residual heterogeneity regardless of how well they are mixed. TOS serves a guide for physical sampling and analysis of powder mixtures, when stating that both material heterogeneity and the adequacy of the sampling procedure employed are sources of significant sampling errors, which are to be suppressed as much as possible (preferentially eliminated completely, where possible). There is only one way to go about this.
One of the most important aspects of TOS is that it is possible to counteract heterogeneity through composite sampling (combined with effective mixing when this possible in the process context). The objective of composite sampling is not primarily a larger compound sample size, or a larger light beam footprint with which to interact with the blend. Composite sampling is primarily about extracting a number of increments specifically to “cover” the full volume of the lot. In the case of process monitoring, the lot is a predetermined process interval. By acquiring NIR spectra from a number of locations along the process stream, a very effective composite sample is aggregated, to be subjected to analysis. Depending upon the number of increments decided upon, the composite sample naturally will also be a larger sample which is always better with respect to representativity.
The composite sample is either brought to the analytical lab, where it is very likely subjected to appropriate sub-sampling, mixing a.o. pre-analysis steps, before, in the end, a representative aliquot is analysed (“physical composite sampling”). In other words: the contents of the sample cell is analysed.
Or, in the process analytical realm (the PAT regimen), spectrometric analysis is performed on-line in a suitably designed sampling cell, allowing for a series of spectra representing serial increments to be obtained and aggregated (“NIR composite sampling”). This is where TOS’ unveiling of unnecessary IDE/IEE assumes a critical role, because these will impart a sampling bias from which there is no escape once permitted. The role of TOS is, as always for any sampling system, to guide towards unbiasedness and sampling variance minimisation.10,12–16,19–21
NIR spectroscopy composite sampling
Provided the spectroscopic sampling issues outlined above have been adequately resolved,10,15–18 an unbiased “optical composite sample” will have been obtained using NIR or Raman spectroscopy; for example, when multiple spectra of a flowing blend are averaged. As an example, 16 or 32 individual scans, representing 16 or 32 optical increments, may be averaged as a very good composite sample for a flowing powder mixture. At the same time, 100 or more spectra may be obtained for each calibration blend, preparing the way for a perfunctory multivariate calibration of a NIR prediction model. In this way, multiple TOS-correct spectra of all calibration blends will be available covering the whole process lot in question. This has been termed a “two-step sampling composite” approach, which is now commonly used in NIR spectroscopy by many researchers.15 The critical success factor for this approach to work adequately is that all the physical–optical sampling issues indicated above were indeed resolved to a level of “fit-for-purpose” representative. Often in today’s PAT applications, however, this demand is violated because the spectra involved in the averaging only represent the surface of the stream to a certain, non-complete, depth and may also be afflicted by incomplete coverage of the flowing stream in the transverse direction, Figure 2. Unfortunately, this deficiency cannot be rectified after the fact by whatever chemometric data modelling may be used; as is argued in detail below.
Blends need to flow to become tablets
Pharmaceutical blends are seldom the final process product, which usually are capsules or tablets. Pharmaceutical blends must flow from a blender to a tablet compressing machine. This powder flow provides the opportunity for Lot Dimensionality Transformation, one of the governing principles of TOS. For the full pharmaceutical production process, the material within a tumble blender would require sampling in three dimensions to access all parts of the blender, but there are numerous, very serious issues associated with this.1–3,19–22 Sampling from a blender is no longer considered adequate, ibid.
However, when the mixed material flows through the feed frame of a compressing (tableting) machine, one dimension dominates in space and time, if/when all spectra are obtained across the full width–depth of this focused flowing lot. This is much easier to obtain in the feed-frame than anywhere else, because here the flow is restricted to the smallest thickness obtainable throughout in pharmaceutical powder transportation. In this case, the material has been transformed from a 3-D lot (blender) to a 1-D lot (feed frame). The transformation to 1-D also makes it possible to perform variographic analysis, obtaining an estimate of the sampling and analytical errors involved.15,19,23–25 Much more on these powerful aspects of TOS involvement in NIR spectroscopy PAT applications in later columns.
Fundamental Sampling Principle—feed frame
A critical demand from TOS is that all parts of the lot have the same opportunity of being sampled (Fundamental Sampling Principle). This demand is difficult to meet with the current location of spectroscopic approaches used to monitor pharmaceutical process, due to limitations in the depth of penetration of the radiation a.o. as illustrated in Figure 2.
The feed frame, shown in Figure 3, is the last place to apply on-line sampling-and-analysis before the powder enters the tableting dies, and this location actually facilitates the most relevant measurements of blend uniformity, with respect to the tablet’s drug concentration.12 The powder wheel speed distributes the incoming blends within the feed frame in a process that is equivalent to generating a composite sample.13 The powder flow dynamics inside the feed frame cause a wave behaviour that promotes rearrangement of particles (optimal final mixing) that also contribute to increasing the probability to all parts of a lot have the same opportunity of being sampled.14,15 The NIR probe localisation must be carefully selected to obtain a reproducible measurement regimen and to avoid any stagnation of the powder flow.12,16 Real-time monitoring by NIR or Raman spectroscopy of powders within the feed frame of a compressing machine is currently the best approach for meeting the Fundamental Sampling Principle (FSP).26–31
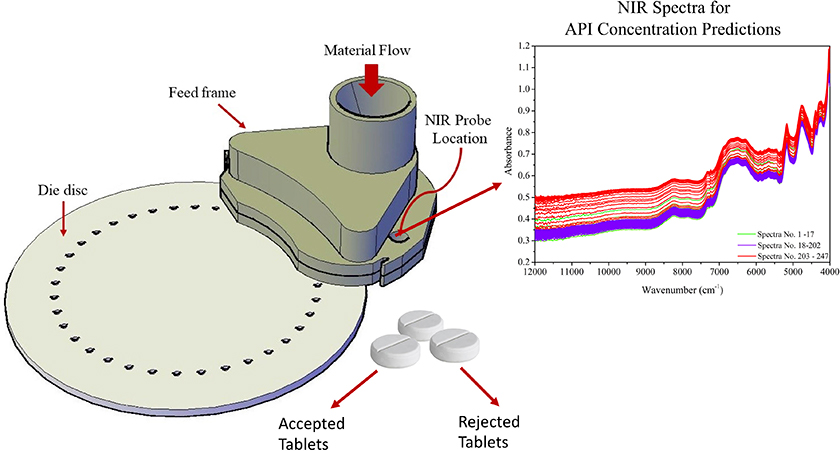
Figure 3. Tablet press feed frame with in-line API measurement location indicated, “NIR probe location”. API: Active Pharmaceutical Ingredient.
Continuous mixers (continuous blenders), shown in Figure 2, also provide a constant flow of material that may be analysed through variographic analysis.19,25 A continuous mixer provides a dynamic 1-D lot with one dominant dimension along time. Here variographic analysis has been used to decouple the sampling and analytical errors from the true process variability in continuous manufacturing.30,32,33
Riding the wave
The above outlines many exciting possibilities for interaction between NIR spectroscopy, chemometrics and TOS; reports from this front are currently showing up with increasing speed in the dedicated literature. The advantages of continuous manufacturing are now widely recognised.34 More aspects of the above scenarios shall be presented in later columns.
Consequences for multivariate calibration/evaluation
The above issues have critical implications for multivariate calibration and validation as used in chemometrics. What is far from always fully understood and acknowledged is that conventional root mean square error of prediction (RMSEP) estimates [the adverse consequences of using root mean square error of cross validation (RMSECV) have been presented35] includes all error components, not only measurement errors stemming from NIR or Raman spectroscopy. Specifically, RMSEP includes all sampling errors that have been incurred in the on-line PAT signal acquisition process if not properly reduced or eliminated in the design and operation of flow-through cells.10 These TSE (Total Sampling Errors) very nearly always dominate overwhelmingly over the strict Total Analytical Errors (TAE).
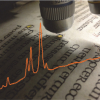
This has the consequence that a broad dispersion surrounding a particular “predicted vs measured” relationship (“too broad” for prediction satisfaction), can in no way be rectified by calling for “more samples”. This is abundantly clear from the fact that “more samples” will be impacted by the very same TSE + TAE as those currently involved in the calibration/validation. Thus “more samples” will not work; more samples of the same kind are equally afflicted by the same levels of TSE + TAE. There is a full discussion of all these issues in Reference 35.
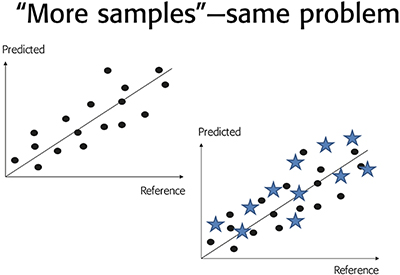
Figure 4. Unsatisfactory, “too broad” dispersion around a “predicted vs reference” relationship for a particular NIR spectroscopy calibration. A call for “more samples” will only serve to substantiate the same dispersion, and can, against common misunderstandings, never lead to a reduction in RMSEP.
The only remedy for this case, which unfortunately is quite prevalent in the NIR/Raman-chemometric realms of multivariate calibration/validation, is to master TOS to a degree that will allow one to make improvements to the sampling + analysis systems employed (in 99 out of 100 cases this will be because of sloppy sampling practice).
Significantly, the pharmaceutical, the NIR/Raman spectroscopy and the chemometric fields have recently seen publication of didactic literature with full initiation to these critical success factors.15,16,35
TOS to the fore!
References
- J. Berman, A. Schoeneman and J.T. Shelton, “Unit dose sampling: a tale of two thieves”, Drug Dev. Ind. Pharm. 22(11), 1121 (1996). https://doi.org/10.3109/03639049609065948
- J.K. Prescott and T.P. Garcia, “A solid dosage and blend content uniformity troubleshooting diagram”, Pharm. Technol. 25(3), 68 (2001).
- G. Boehm, J. Clark, J. Dietrick, L. Foust, T. Garcia, M. Gavini, L. Gelber, J.-M. Geoffroy, J. Hoblitzell, P. Jimenez, G. Mergen, F. Muzzio, J. Planchard, J. Prescott, J. Timmermans and N. Takiar, “The use of stratefied sampling of blend and dosage units to demonstrate adequacy of mix for powder blends”, PDA J. Pharm. Sci. Technol. 57(2), 64 (2003).
- R.J. Romañach, “Sampling and determination of adequacy of mixing”, in Pharmaceutical Blending and Mixing. John Wiley & Sons Ltd, pp. 57–78 (2015). https://doi.org/10.1002/9781118682692.ch4
- R.J. Romañach, “Theory of Sampling—from missing link to key enabler for process analytical technology (PAT)”, in 8th World Conference on Sampling and Blending, Ed by S.C. Dominy and K.H. Esbensen. Australian Institute of Mining and Metallurgy, Perth, Australia, pp. 63–68 (2017).
- U.S. Department of Health and Human Services, F.D.A., ANDA’s: Blend Uniformity Analysis; Withdrawal of Draft Guidance. Vol. Docket No. 99D-2635 (2002).
- U.S. Department of Health and Human Services, F. D. A., Questions and Answers on Current Good Manufacturing Practices, Good Guidance Practices, Level 2 Guidance—Production and Process Controls. http://bit.ly/2peBe5q (accessed 26 October YEAR).
- U.S. Department of Health and Human Services, F.D.A., Guidance for Industry—PAT A Framework for Innovative Pharmaceutical Development, Manufacturing, and Quality Assurance, pp. 1–19 (2004).
- U.S. Department of Health and Human Services, F.D.A., Pharmaceutical CGMPS for the 21st Century—A Risk-Based Approach Final Report (2004).
- K.H. Esbensen and P. Paasch-Mortensen, “Process sampling: theory of sampling – the missing link in process analytical technologies (PAT)”, in Process Analytical Technology. John Wiley & Sons Ltd, pp. 37–80 (2010). https://doi.org/10.1002/9780470689592.ch3
- R.L. Green, G. Thurau, N.C. Pixley, A. Mateos, R.A. Reed and J.P. Higgins, “In-line monitoring of moisture content in fluid bed dryers using near-IR spectroscopy with consideration of sampling effects on method accuracy”, Anal. Chem. 77(14), 4515 (2005). https://doi.org/10.1021/ac050272q
- DS 3077. Representative Sampling—Horizontal Standard. Danish Standards Foundation (2013). http://www.ds.dk
- L. Petersen and K.H. Esbensen, “Representative process sampling for reliable data analysis—a tutorial”, J. Chemometr. 19(11–12), 625 (2005). https://doi.org/10.1002/cem.968
- L. Petersen, P. Minkkinen and K.H. Esbensen, “Representative sampling for reliable data analysis: Theory of Sampling”, Chemometr. Intell. Lab. Syst. 77(1–2), 261 (2005). https://doi.org/10.1016/j.chemolab.2004.09.013
- K.H. Esbensen, R.J. Romañach and A.D. Román-Ospino, “Theory of Sampling (TOS): a necessary and sufficient guarantee for reliable multivariate data analysis in pharmaceutical manufacturing”, in Multivariate Analysis in the Pharmaceutical Industry, Ed by A.P. Ferreira, J.C. Menezes and M. Tobyn. Academic Press, Ch. 4, pp. 53–91 (2018). https://doi.org/10.1016/B978-0-12-811065-2.00005-9
- K.H. Esbensen and R.J. Romañach, “Sampling for NIR-analysis”, in Handbook of NIR Spectroscopy, Ed by B. Igne and E.W. Ciurczak. Accepted for publication.
- M. Iyer, H. Morris and J. Drennen, “Solid dosage form analysis by near infrared spectroscopy: comparison of reflectance and transmittance measurements including the determination of effective sample mass”, J. Near Infrared Spectrosc. 10(4), 233 (2002). https://doi.org/10.1255/jnirs.340
- C. Ortega-Zuñiga, K. Reyes-Maldonado, R. Méndez and R.J. Romañach, “Study of near infrared chemometric models with low heterogeneity films: The role of optical sampling and spectral preprocessing on partial least squares errors”, J. Near Infrared Spectrosc. 25(2), 103 (2017). https://doi.org/10.1177/0967033516686653
- K.H. Esbensen, A.D. Román-Ospino, A. Sanchez and R.J. Romañach, “Adequacy and verifiability of pharmaceutical mixtures and dose units by variographic analysis (Theory of Sampling)—A call for a regulatory paradigm shift”, Int. J. Pharm. 499(1–2), 156 (2016). https://doi.org/10.1016/j.ijpharm.2015.12.038
- F.J. Muzzio, P. Robinson, C. Wightman and D. Brone, “Sampling practices in powder blending”, Int. J. Pharm. 155(2), 153 (1997). https://doi.org/10.1016/S0378-5173(97)04865-5
- R.J. Romañach and K.H. Esbensen, “Sampling in pharmaceutical manufacturing—Many opportunities to improve today’s practice through the Theory of Sampling (TOS)”, TOS Forum 4, 5 (2015). https://doi.org/10.1255/tosf.37
- G. Boehm, J. Clark, J. Dietrick, L. Foust, T. Garcia, M. Gavini, J.-M. Geoffroy, P. Jimenez, G. Mergen, F. Muzzio, J. Planchard, J. Prescott, J. Timmermans, N. Takiar and D. Whiteman, “Results of statistical analysis of blend and dosage unit content uniformity data obtained from the Product Quality Research Institute Blend Uniformity Working Group data-mining effort”, PDA J. Pharm. Sci. Technol. 58(2), 62 (2004).
- K.H. Esbensen and L.P. Julius, “Representative sampling, data quality, validation—a necessary trinity in chemometrics”, in Comprehensive Chemometrics, Ed by S.D. Brown, R. Tauler and B. Walczak. Elsevier, pp. 1–20 (2009). https://doi.org/10.1016/B978-044452701-1.00088-0
- R.J. Romañach, A. Sanchez-Paternina and K.H. Esbensen, “Variographic analysis of 1-D lots in pharmaceutical manufacturing (powder mixing)”, American Pharmaceutical Review 21(1), 22–26 (2018).
- A. Sánchez-Paternina, N.O. Sierra-Vega, V. Cárdenas, R. Méndez, K.H. Esbensen and R.J. Romañach, “Variographic analysis: a new methodology for quality assurance of pharmaceutical blending processes”, Comput. Chem. Eng. 124, 109 (2019). https://doi.org/10.1016/j.compchemeng.2019.02.010
- E.M. Hetrick, Z. Shi, L.E. Barnes, A.W. Garrett, R.G. Rupard, T.T. Kramer, T.M. Cooper, D.P. Myers and B.C. Castle, “Development of near infrared spectroscopy-based process monitoring methodology for pharmaceutical continuous manufacturing using an offline calibration approach”, Anal. Chem. 89(17), 9175 (2017). https://doi.org/10.1021/acs.analchem.7b01907
- Y. Li, C.A. Anderson, J.K. Drennen, C. Airiau and B. Igne, “Method development and validation of an inline process analytical technology method for blend monitoring in the tablet feed frame using Raman spectroscopy”, Anal. Chem. 90(14), 8436 (2018). https://doi.org/10.1021/acs.analchem.8b01009
- P. Durão, C. Fauteux-Lefebvre, J.-M. Guay, N. Abatzoglou and R. Gosselin, “Using multiple Process Analytical Technology probes to monitor multivitamin blends in a tableting feed frame”, Talanta 164, 7 (2017). https://doi.org/10.1016/j.talanta.2016.11.013
- N.O. Sierra-Vega, A. Sánchez-Paternina, N. Maldonado, V. Cárdenas, R.J. Romañach and R. Méndez, “In line monitoring of the powder flow behavior and drug content in a Fette 3090 feed frame at different operating conditions using near infrared spectroscopy”, J. Pharm. Biomed. Anal. 154, 384 (2018). https://doi.org/10.1016/j.jpba.2018.03.017
- N.O. Sierra-Vega, A. Román-Ospino, J. Scicolone, F.J. Muzzio, R.J. Romañach and R. Méndez, “Assessment of blend uniformity in a continuous tablet manufacturing process”, Int. J. Pharm. 560, 322 (2019). https://doi.org/10.1016/j.ijpharm.2019.01.073
- C. Ortega-Zúñiga, C.P.-D. la Rosa, A.D. Román-Ospino, A. Serrano-Vargas, R.J. Romañach and R. Méndez, “Development of near infrared spectroscopic calibration models for in-line determination of low drug concentration, bulk density, and relative specific void volume within a feed frame”, J. Pharm. Biomed. Anal. 164, 211 (2019). https://doi.org/10.1016/j.jpba.2018.10.046
- J.M. Vargas, A.D. Roman-Ospino, E. Sanchez and R.J. Romañach, “Evaluation of analytical and sampling errors in the prediction of the active pharmaceutical ingredient concentration in blends from a continuous manufacturing process”, J. Pharm. Innov. 12(2), 155 (2017). https://doi.org/10.1007/s12247-017-9273-1
- J.M. Vargas, S. Nielsen, V. Cárdenas, A. Gonzalez, E.Y. Aymat, E. Almodovar, G. Classe, Y. Colón, E. Sanchez and R.J. Romañach, “Process analytical technology in continuous manufacturing of a commercial pharmaceutical product”, Int. J. Pharm. 538(1–2), 167 (2018). https://doi.org/10.1016/j.ijpharm.2018.01.003
- M. Ierapetritou, F. Muzzio, and G. Reklaitis, “Perspectives on the continuous manufacturing of powder-based pharmaceutical processes”, AIChE J. 62(6), 1846 (2016). https://doi.org/10.1002/aic.15210
- K.H. Esbensen and B. Swarbrick, Multivariate Data Analysis – In Practice. An Introduction, 6th Edn. CAMO, Oslo, Norway (2018). https://www.amazon.com/Multivariate-Data-Analysis-introduction-Analytical-ebook/dp/B07BBJS6CZ

Dr Rodolfo Romañach is Professor of Chemistry at the University of Puerto Rico – Mayagüez Campus, and site leader for the Center for Structured Organic Particulate Systems. He worked in the pharmaceutical industry for over 12 years before joining the UPR Chemistry Department in 1999. He found his mission in training a new generation of pharmaceutical scientists capable of doing real time process measurements in the manufacturing area. He is presently continuing efforts to improve the teaching of chemometrics and further his understanding of the errors that affect real time process measurements—and what to do about all this.

Dr Rafael Mendez is Professor of Chemical Engineering Department at the University of Puerto Rico – Mayagüez Campus. He has worked in pharmaceutical research for over 10 years, focused on particle technology, continuous manufacturing process and real-time API concentration measurements using chemometrics. He teaches courses on process technology and particulate systems to undergraduate and graduate students to enhance understanding powder flow phenomena and the effect of powder processing on powder properties.

Kim Esbensen, PhD, Dr (hon) has been research professor in geoscience data analysis and sampling at GEUS, the National Geological Surveys of Denmark and Greenland (2010–2015), chemometrics & sampling professor at Aalborg University, Denmark (2001–2015), professor (Process Analytical Technologies) at Telemark Institute of Technology, Norway (1990-2000 and 2010-2015) and professeur associé, Université du Québec à Chicoutimi (2013-2016). From 2015 he phased out a 30+ year academic career for a new quest as an independent researcher and consultant founding KHE Consult. A geologist/geochemist/data analyst of training, he first worked 20+ years in the forefront of chemometrics, but since 2000 has devoted most of his efforts to representative sampling of heterogeneous materials, processes and systems (Theory of Sampling, TOS), PAT (Process Analytical Technology) and chemometrics. He is a member of several scientific societies and has published over 260 peer-reviewed papers and is the author of a widely used textbook in Multivariate Data Analysis, published in its 6th edition in 2018. He was chairman of the taskforce behind the world’s first horizontal (matrix-independent) sampling standard (2013), DS 3077. He is a co-founding council member, treasurer and webmaster for the International Pierre Gy Sampling Association and is editor of the magazine TOS forum, as well as for the Spectroscopy Europe Sampling Column.