
Articles
I recently “discovered” a very interesting radio programme on BBC Radio 4. It is “devoted to the powerful, sometimes beautiful, often abused but ever ubiquitous world of numbers”. A few weeks ago we were asked to say what we were doing while listening to the programme. The next week we were told that nearly 2000 e-mails had been received and this data had been given to information designer David McCandless to turn into a graphic. When this was trailed I got the impression that something new and exciting was going to be displayed and I thought that the graphic would include sound. The graphic is good but rather “ordinary” and I was disappointed. This got me thinking about how we display information. Have we made any advance in the last 25 years? Could sound be used!
A.M.C. Davies
Norwich Near Infrared Consultancy, 75 Intwood Road, Cringleford, Norwich NR4 6AA, UK. E-mail: [email protected]
Tom Fearn
Department of Statistical Science, University College London, Gower Street, London WC1E 6BT, UK. E-mail: [email protected]
Tony Davies
Norwich Near Infrared Consultancy, 75 Intwood Road, Cringleford, Norwich NR4 6AA, UK
Fans of “Monty Python’s Flying Circus” will realise that what follows is not likely to be my usual column (and they might be hoping that it will be amusing).
Introduction
This column is about “Computational Chemistry”.
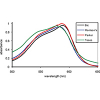
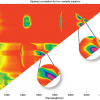
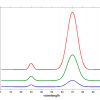
This short review shows that UV/visible spectroscopy plays a key role in the discrimination of colour in the forensic analysis of fibres and inks. The application of chemometrics, however, is vital in many cases to enhance such discrimination and to put it on a quantitative basis so providing objective justification for the conclusions of the analyst.
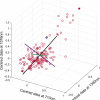
In our previous column we introduced CVA, one of the very early applications of multivariate analysis (1930s). In this column we will discuss SIMCA (officially it is Soft Independent Modelling of Class Analogies, but no one uses the long form!). SIMCA was invented 30 years later by another pioneer, Svante Wold (the man who coined the word “chemometrics”).
A.M.C. Daviesa and Tom Fearnb
aNorwich Near Infrared Consultancy, 75 Intwood Road, Cringleford, Norwich NR4 6AA, UK. E-mail: [email protected]
bDepartment of Statistical Science, University College London, Gower Street, London WC1E 6BT, UK. E-mail: [email protected]
A.M.C. Davies and Tom Fearn
Norwich Near Infrared Consultancy, 75 Intwood Road, Cringleford, Norwich NR4 6AA, UK. E-mail: [email protected]
Department of Statistical Science, University College London, Gower Street, London WC1E 6BT, UK. E-mail: [email protected]
The starting point for this column is the last one from last year! In that column TD began what was intended to be a two-part story but has, with this column, become a story in four parts. There were required topics we had not covered and we need to begin this column by completing the discussion of removing multiplicative effects by describing what the two most popular methods do to NIR spectra.
The last TD column showed the effect of calculating second derivatives on a set of 100 spectra, which will be the starting point for this column.
This column is about the most basic of pre-treatments, which has been used in spectroscopy well before the word "Chemometrics" was invented.
A.M.C. Davies
Norwich Near Infrared Consultancy, 75 Intwood Road, Cringleford, Norwich NR4 6AA, UK. [email protected]
N.M. Faber,a,* and R. Rajkób
aChemometric Consultant, Rubensstraat 7, 6717 VD Ede, The Netherlands. [email protected]
bDepartment of Unit Operations and Food Engineering, Szeged College of Food Engineering, University of Szeged, H-6701 Szeged, POB 433, Hungary
A.M.C. Davies
Norwich Near Infrared Consultancy, 75 Intwood Road, Cringleford, Norwich NR4 6AA, UK
A.M.C. Daviesa and Tom Fearnb
aNorwich Near Infrared Consultancy, 75 Intwood Road, Cringleford, Norwich NR4 6AA, UK
bDepartment of Statistical Science, University College London, Gower Street, London, UK
A.M.C. Daviesa and Tom Fearnb
aNorwich Near Infrared Consultancy, 75 Intwood Road, Cringleford, Norwich NR4 6AA, UK
bDepartment of Statistical Science, University College London, Gower Street, London, UK
A.M.C. Daviesa and Tom Fearnb
aNorwich Near Infrared Consultancy, 75 Intwood Road, Cringleford, Norwich NR4 6AA, UK
bDepartment of Statistical Science, University College London, Gower Street, London, UK
A.M.C. Davies
Norwich Near Infrared Consultancy, 75 Intwood Road, Cringleford, Norwich NR4 6AA, UK
Introduction
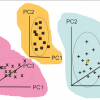
In my last column I began a revision of basic chemometrics.1 In this column I will discuss some interpretation of the results produced by principal component analysis (PCA) as part two of this revision programme.
Tony Davies
External Professor, University of Glamorgan, UK, c/o Waters Informatics, Europaallee 27–29, 50226 Frechen, Germany
PCA is a mathematical method of reorganising information in a data set of samples. It can be used when the set contains information from only a few variables but it becomes more useful when there are large numbers of variables, as in spectroscopic data.
A.M.C. Davies
Norwich Near Infrared Consultancy, 75 Intwood Road, Cringleford, Norwich NR4 6AA, UK
