John P. Hammond
Technical Manager, Starna Scientific Limited, 52–54 Fowler Road, Hainault, Essex IG6 3UT, UK
DOI: https://doi.org/10.1255/sew.2022.a7
© 2022 The Authors
Published under a Creative Commons BY-NC-ND licence
Introduction
As stated in the last article, we will now consider the essential component that controls our modern instrument systems and the associated concept of data integrity that is fundamental to the quality of the data being generated.
Researching this topic, as an article within this Four Generations series, confirmed my statement in the introductory article:
“As someone who has been involved with the science of analytical measurement and/or spectroscopy for the majority of my adult life, this period of reflection centred not only on the last 12 months, but importantly on the changes since I started in a QA laboratory many years ago.”
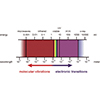
If I related this time frame specifically to the development and evolution of UV/visible instrumentation, once again the chronology of the software and data integrity can be effectively mapped to the timelines, and as in many technical areas impacting on our modern lives, there is the interesting conversion of analogue to digital electronics. For a more detailed insight into this electronic transition of our scientific instrumentation, no pun intended, see the detailed discussion below.
For both the personal and additional insight into this evolution, I am grateful to, and wish to thank, my colleague at Pye Unicam, Doug Irish, whose History of UV-Vis document1 provided essential chronology of what had happened before I joined the Unicam organisation in 1988 as a UV Application Specialist. However, whilst the evolution of the Unicam UV/visible instruments over the four generations are used as an example, the change in fundamental electronic hardware (with perhaps one or two exceptions) could be applied to most analytical systems from major vendors found in the laboratory of the day.
This article, therefore, discusses the Four Generations in the previously described time periods and uncovers some of these unique points for discussion.
1st Generation: the years between 1940 and 1975
The Beckman DU spectrophotometer had been developed in 1941 by Arnold Beckman, which introduced an instrumental measurement process capability to the comparison and use of visual colour science, and effectively enabled the quantitative measurement of a chemical species, by use of an associated method calibration process. Approximately 30,000 DU spectrophotometers were manufactured and sold between 1941 and 1976, and, therefore, this, and other key events, provides a convenient break in the chronologic timeline.
From a UK perspective, in the late 1940s the country was basically bankrupt, with no cash resource to buy American-made instruments. The “Urban Myth” is that the UK government loaned Unicam a Beckman DU instrument for a weekend and in essence asked them to reverse engineer it, essentially copy it; and the Unicam SP 500 was born. The government also loaned an instrument to Hilger Ltd who produced a similar model—the Uvispec.
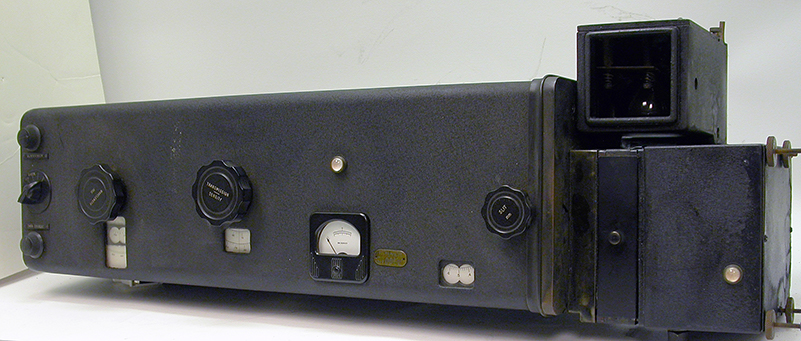
Figure 1. The Beckman DU spectrophotometer. Photo courtesy of the Beckman Institute for Advanced Science and Technology at the University of Illinois Urbana-Champaign
As previously stated,2 from a personal perspective, my journey on the Quality path, began in 1975 in a Quality Assurance (QA) laboratory of a fine chemical supplier, which also had a DU spectrophotometer in the laboratory in which I was employed, but more importantly to the discussion of this article, a “modern” UV from one of those other major vendors with the added capability of scanning a wavelength range on the instrument. How this was achieved could now be described as somewhat quaint, in the fact that the wavelength was selected by rotating a thumbwheel which changed a revolving set of three numbered wheels showing the wavelength in nm, and scanning was produced by engaging a clutch and motor, and watching the wavelength numbers rotate and drive down. As an optional output, this instrument also had the capability to connect a chart recorder for a visual recording of the spectrum. Little did I appreciate at this time that, even in this analogue configuration, the concept of data integrity still existed. Selection of a chart recorder speed that was too fast for the output of the instrument would cause a distortion, i.e. skewing of the peak shape. It wasn’t until the microprocessor controlled analogue systems described below arrived that unacceptable scan and/or chart recorder speed combinations were locked out, thereby improving the integrity of the data.
The success of the SP 500 was followed in 1952 by the SP 600, and the SP 700 in 1958. The SP 700 was very much a copy of the Cary 14—then regarded as the “Rolls Royce” of spectro(photo)metry. Howard Cary was the designer behind the Beckman DU, but left Beckman to set up his own company following a dispute with Beckman over the merits of single- vs double-beam spectro(photo)meters; a debate which subsequently was to be replayed during the development at Unicam of the PU 8700 in the 1980s, but more of this revolutionary instrument later.
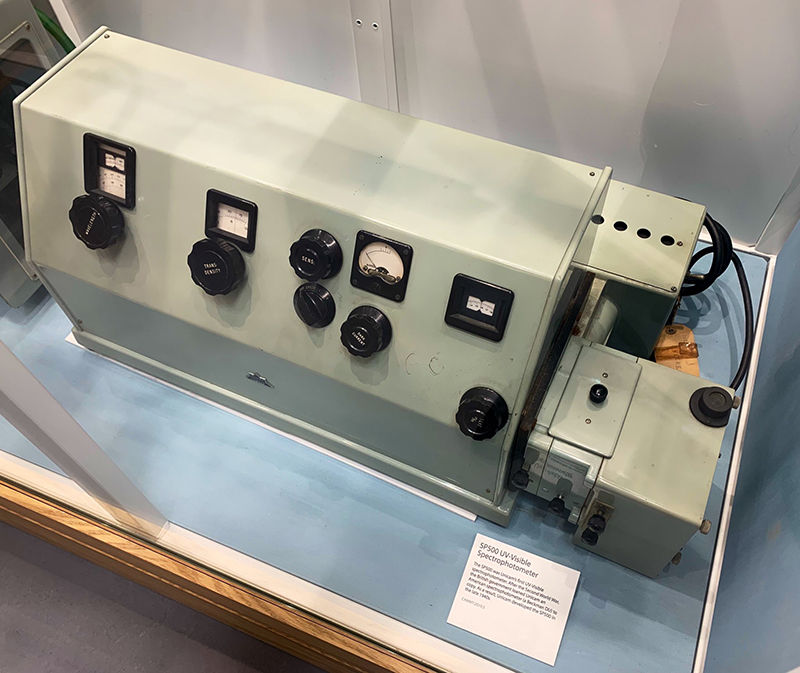
Figure 2. Pye Unicam SP500 UV/visible spectrophotometer. Photo © Ian Michael 2019, reproduced with kind permission of the Pye History Trust, Cambridge, UK.
Software
So, unsurprisingly in this 1st generation, there is no input into this arena, as all control is truly electronic and analogue.
Data integrity
In selection of incorrect chart speed, we see a fundamental premise of Data Integrity is already in play by posing the question, “…is what is being reported the ‘true value’?”.
2nd Generation: the years 1975 to 2000
In Pye Unicam’s chronology, the SP 1800 and SP 1700 marked the start of using diffraction gratings rather than prisms as the dispersing element, and they were double-beam instruments. The SP 1800 had an analogue readout, and the SP 1700 incorporated a digital display for the first time and could be connected to an external chart recorder.
1976 saw the introduction of the SP 8100, SP 8200 and SP 8250. The mechanics and optics of this family of double-beam scanning instruments were to form the backbone of the main Unicam UV/visible instrument family for many years as they migrated into the PU 8300, 400, 500 and 8800 series. The design was based around an Ebert monochromator and used a high sensitivity end window photomultiplier.
The SP 8200 broke new ground in various ways. It was a microprocessor-controlled instrument, incorporating an Intel 4004 chip, the first commercially available microprocessor, and very crude by today’s standards; but with hindsight the same could be said for the same computer systems that landed the USA Apollo lander on the Moon! The main control panel of the SP 8100—mostly rotary knobs and pushbuttons—was replaced by an array of LEDs and buttons. At the time, there was much debate within Unicam as to who would want to buy one of these new-fangled devices and what benefit did the microprocessor confer? For these reasons, the instrument was made in small quantities by a section of Unicam that specialised in making “one-offs”, with a dedicated single software engineer, c.f. the complete reversal of this perception into the modern systems of today. The product became the world’s first microprocessor-controlled UV/visible instrument, beating arch-rivals Perkin-Elmer by a couple of weeks in 1978.
The PU 8800 was launched in 1982 and was based on the optics of the SP 8100 series, but with new electronics and a VDU to display results. A Commodore PET computer was purchased in the USA (circa 1979), long before they were available in the UK as Unicam in the UK had access to 110 V and 60 Hz electrical supply. This was used to design the screen displays on the PU 8800 and the similarities in the chunky letters and numbers between the Commodore and the PU 8800 were very evident.
From a personal perspective, the PU 8800 was my “Rolls Royce” UV/visible, and with its superb optical performance, it truly was a system cable of being used as a reference measurement instrument. This was how I was introduced to this concept of certification measurement/value assignment in a Calibration Laboratory; a protocol actively in use and expanded in the Starna CRM laboratory environment of today, albeit that our reference systems, whilst of a similar optical performance to the PU 8800 are (by necessity) from other leading instrument vendors.
By the early 1980s the basic scanning chassis of the PU 8800 was showing its age and Unicam scanning instruments were not competitive on price in the marketplace. Lessons had been learnt from the PU 8800 with its built in VDU in that the VDU market was fast changing so it was quickly appreciated that any screen had to be an external one.
Major debates were held over the style of user interface and I remember that this was before the appearance of the ubiquitous IBM PC in 1981, which didn’t have a PS/2 mouse until 1986. However, even in 1983, Apple was building a reputation for somewhat unique products, and alongside its Apple IIe computer, it released its Lisa business system, where the user interface was a mouse-driven system. This unique and new rodent-based solution resolved to settle this debate, and the mouse-driven PU 8700 was born, and launched in 1986. Towards the end of its life in the later years of the 1990s, the requirement to also provide PC-based software, using its own mouse control, provided the obvious, but not easily solved duplicity of process, i.e. a system requiring two mice! However, this requirement for both a “local control” and PC-based interface was to prove both fundamentally attractive, and extremely useful in the next and future generation of instruments.
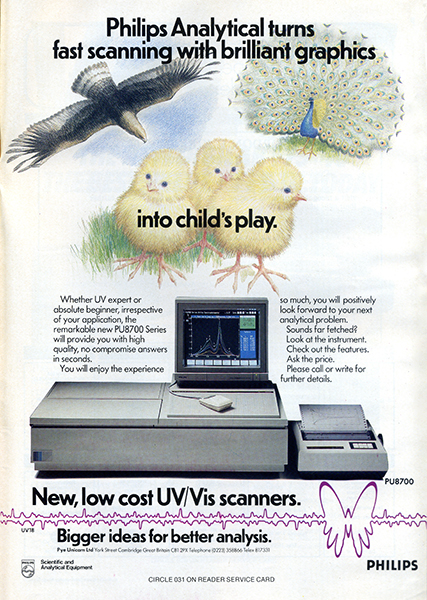
Figure 3. Advertisement for the PU 8700 from ESN—European Spectroscopy News 70 (1990).
The PU 8700 was to be a pseudo double-beam instrument (only one beam was accessible in the sample compartment, but to help improve drift figures, a silica plate in the beam reflected 4 % or so of the light onto a photodiode so that in effect a double-beam system was created). Two microprocessors were used—a Z80 to cope with all the low-level instrument control logic, driving stepper motors etc. and a Motorola 68008 to do all the number crunching and graphics display. To get the colours right on the display, advice was sought from the BBC team that developed Teletext and Ceefax. However, the development of the software proved to be Herculean task—experts from Logica were brought in and warned that Unicam had embarked on too big a task as a unique operating system needed to be developed. Work progressed with an army of software engineers (we were constantly reminded of Brookes’ The Mythical Man-Month, as more and more software engineers and contractors were piled into the project), but eventually the PU 8700 was launched.
Brooks’ law is an observation about software project management according to which “adding manpower to a late software project makes it later”. It was coined by Fred Brooks in his 1975 book The Mythical Man-Month. According to Brooks, under certain conditions, an incremental person when added to a project makes it take more, not less time.
Although the performance of the PU 8700 equalled that of double-beam instruments from competitors, its pseudo double-beam design was inevitably a perceived weakness in the marketplace at the time. However, being microprocessor controlled did allow the PU 8700 to use a stepping motor on its monochromator drive, which effectively allowed Stepped Scanning, i.e. stopping the monochromator at each discrete measurement wavelength, thereby eliminating spectral distortion due to the incorrect selection of too fast a scan speed; a design now found in many modern systems and another plus for Data Integrity.
In the late 1990s, the next family of instruments to be developed was the UV Series which reverted to a traditional double-beam design and was based on a stable optical cast base plate. It was available in either a Local Control version, or as a “blind bench” controlled by a PC and Vision software. The quality in the design of these system, like most Unicam products, is seen in the fact that these systems are still in use in many laboratory environments, including at Starna.
As reported in a previous article in this series, the pharmaceutical industry were demanding features to prove the instrument was working correctly when an analysis was carried out and so a major sales thrust of the product was around the sophisticated performance verification facilities built into the hardware and the corresponding software facilities in the Vision control software. In addition, the concept of providing cross-validation of value assignment/measurement by two independent pathways, i.e. dedicated instrument control and PC; both of which had been rigorously validated was invaluable in meeting the above-stated regulatory requirements, and again in many cases is now the de facto standard design for modern instrument system. Why this is the case is discussed below.
Software
As with so many of the standards and concepts already discussed in this series of articles, the most dramatic and wide-ranging changes occurred over this last quarter of the twentieth century. We literally went from pure analogue electronics, with meter displays and chart recorders, and no software (and/or the associated personnel), to PC and dedicated “local control” systems, where the software required to control these systems was highly developed by a team of skilled engineers, proven to work and more importantly could be shown to have fully tested and compliant with the new and evolving regulations. Sometimes this transition is unkindly referred to as:
“…string and slide wire to full computer control.”
From a UV Series perspective, in parallel with the main instrument development, a significant team continued to refine the Vision PC-based software. Much emphasis was placed on all the aspects of traceability and security required by the pharmaceutical industry as defined in CFR21 - Pt11 by the FDA in America.
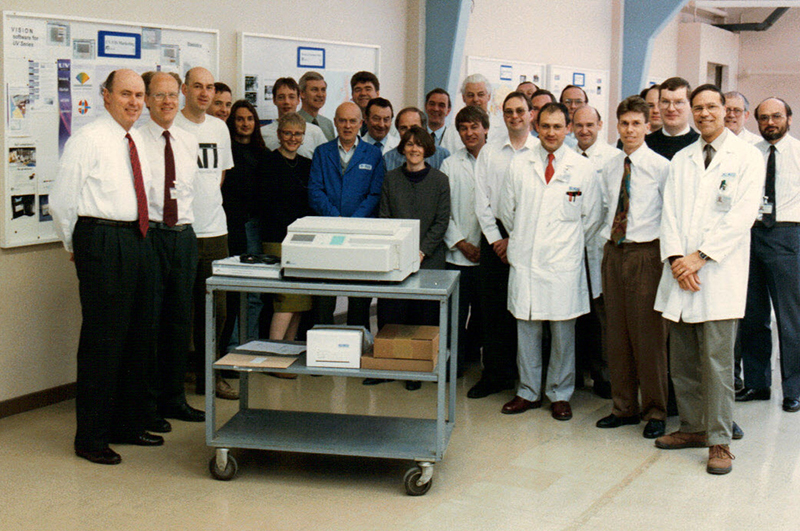
Figure 4. The UV Series team. Photo courtesy of the Pye History Trust.
Data integrity
Once again, a design consideration of an analogue system relating to the accurate interpretation of the data, thereby ensuring its integrity, is the use of a mirrored scale on a meter display. By use of this simple optical enhancement, the possibility of parallax error caused by viewing a meter display from a non-perpendicular angle is eliminated by ensuring only one needle image is visible when the scale is read. Once the moving meter was replaced by a digital numeric display, it might be perceived that (even using a mirrored scale) a simple number digital number is more accurate than a meter reading? The debate relating to the discussion to this “black box” syndrome started at this point, and continues even more vehemently to this day, as clearly even though digital in presentation, it is just a number, right or wrong?
In the UV Series, having the ability to measure the same reference material within both a Local Control and PC environment, and thereby cross-validate the data, and ensure its integrity provided invaluable in proving the acceptance of this approach in a regulated environment.
Finally, at the end of the Millennium, and now fading into the mists of time, who can remember the fear that was circulated in the last months by the impending doom of the “Millennium Bug”? Where, because software had only be coded to recognise two digit dates, as the clock struck one second after midnight on 31 December 1999, all internal software clocks would revert to 1 January 1900, with the expected consequences!
Thankfully, the predicted catastrophe didn’t materialise, but surely this was a salutary lesson as to how easy the integrity of the data can be compromised.
3rd Generation: the years 2000 to 2020
The Evolution series of instruments was to be the last family of Unicam UV/visible instruments to be developed in Cambridge (around 2002). Certain components of the UV Series were becoming obsolete, and the Evolution was effectively its replacement. Much discussion took place as to what was the primary target market, and it was agreed this should be Life Sciences. The implication of this was for a small beam of light in the sample compartment (to pass through small cells) and a double-beam instrument with a wide beam separation (to allow cell changers to operate). A major innovation was to incorporate a Xenon flash lamp as the light source, so eliminating the need for the traditional Deuterium and Tungsten lamps.
Software
During this period in the consumer marketplace, we see the increasing replacement of desktop PCs by laptops, and latterly tablets and mobile phones, so we are now all familiar with the user interfaces available on these devices in the form of Apps etc., and we see systems appearing on the marketplace where (in particular) the availability of screens used for tablets etc. are used for this purpose. Also, invariably in a modern laboratory these system(s) are linked together to a central core, via a LIMS system, database etc.
Data integrity
As we have seen in the evolutionary process of the dedicated software systems, on whichever platform for which they are developed, the requirement to ensure the validity of the data, and preserve its integrity has increased almost exponentially. For that reason, given the availability of other commercially based tools, e.g. Excel, this period did see an expansion in the use of these calculation-based tools to provide additional functionality to a system. However, in recent times, a similar discussion/debate revolves around a number producing worksheet, i.e. is it providing the correct answer—“sound familiar”, c.f. digital display discussion?
As stated above, linking systems together brings its own headaches with respect to the protection and preservation of the data integrity.
4th Generation: from 2021 forward
So now we have a modern laboratory, with a fully integrated, fully validated LIMS system—what next? As we cannot see into the future, we can only discuss some key concepts currently being considered, and these are listed below as discussion points.
Software
Given the progression and use of software systems into the “Cloud” in many commercial arenas, will this continue for the laboratory of the future?
Data integrity
How to preserve the integrity of the data in these new environments; is Block Chaining a solution to the problem, or (as recently described to me) use of voice-recognition software, to ensure authenticity of the process?
Given that we now have all the components in place to measure, manipulate and produce the quality data required from a system, and perhaps more importantly, prove it, the next article in the series will look at some of the recent uses and applications of these fundamental spectroscopic techniques.
References
- D. Irish, UltraViolet and Visible Spectrometry (UV/Vis). Pye History Trust. bit.ly/PyeTrust
- J.P. Hammond, “Four generations of Quality: into the future”, Spectrosc. Europe 33(2), 32–35 (2021). https://doi.org/10.1255/sew.2021.a10
John Hammond
John Hammond is an experienced analytical scientist, spectroscopist and technical marketing professional, skilled in the development, production and marketing of analytical systems into highly regulated and controlled industries. A Fellow of the Royal Society of Chemistry (FRSC), executive member of ISO/TC334 and an Expert Advisor to the United States Pharmacopeia, General Chapters, Chemical Analysis committee.
[email protected]