Javier A. Romero,a Krzysztof Kazimierczuka and Dariusz Gołowicza,b
aCenter of New Technologies, University of Warsaw, Banacha 2c, 02-097, Warsaw, Poland
bFaculty of Chemistry, University of Warsaw, Pasteura 1, 02-093, Warsaw, Poland
DOI: https://doi.org/10.1255/sew.2021.a7
© 2021 The Authors
Published under a Creative Commons BY-NC licence
Introduction
Analytical chemists often make use of nuclear magnetic resonance (NMR) spectroscopy to identify molecules and measure their concentrations. NMR has many advantages as a technique for such an analysis: it is non-invasive and requires minimal bench time (sample preparation). Moreover, the NMR signal is linear versus concentration of nuclei of a given type and thus quantitative NMR (qNMR) is possible using reference standards different from the analyte. The technique has become a reliable tool for monitoring industrial processes in many areas. It is used, for example, to investigate the stability of oil-containing cosmetics.1
However, NMR suffers from relatively low sensitivity. To reach nanomolar limits of detection one has to use high magnetic fields and cryogenically cooled probes that are beyond the reach of most analytical laboratories. In recent years, a more accessible technology has started to receive much attention: benchtop NMR (BT-NMR). These compact designs are cost-effective, easy-to-operate and are becoming preferred tools for process monitoring2 and steps in basic research. BT-NMR spectrometers use permanent magnets to operate, as opposed to the more expensive superconductive magnets (whose maintenance costs have increased significantly recently with the rising price of liquid helium). The trade-offs for compactness, however, are decreased spectral resolution and sensitivity compared to high-field spectrometers. This is because both resolution and sensitivity scale up with a magnetic field used in an NMR spectrometer.
BT-NMR has opened a way to use NMR in numerous new applications and nowadays many companies produce their own models of mini-spectrometers. New generation BT-NMR systems reach working frequencies of 80 MHz, but a loss in sensitivity remains as a major obstacle. As in many other kinds of experiments, signal-to-noise ratio (SNR) in NMR can be increased by collecting many scans (n) and adding them together. This results in an √n improvement of SNR. However, one has to pay special attention to the longitudinal (spin-lattice) relaxation times (T1) characterising the process of recovering the equilibrium state sample magnetisation between scans. Without an efficient recovery (too short inter-scan delays) the SNR will be reduced and relative peak intensities may be biased.
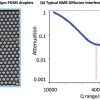
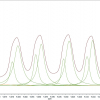
NMR measurements are performed on the active volume of the sample that fills the receiver radiofrequency (RF) coil. This volume corresponds with the most homogeneous region of the magnetic field, although the magnetic field spans a much larger region and can still adequately polarise the sample outside of the active volume. The active volume represents but a small fraction of the sample (see Figure 1), while the rest of the sample (in the vicinity of the active volume) is magnetised but typically unused in NMR.
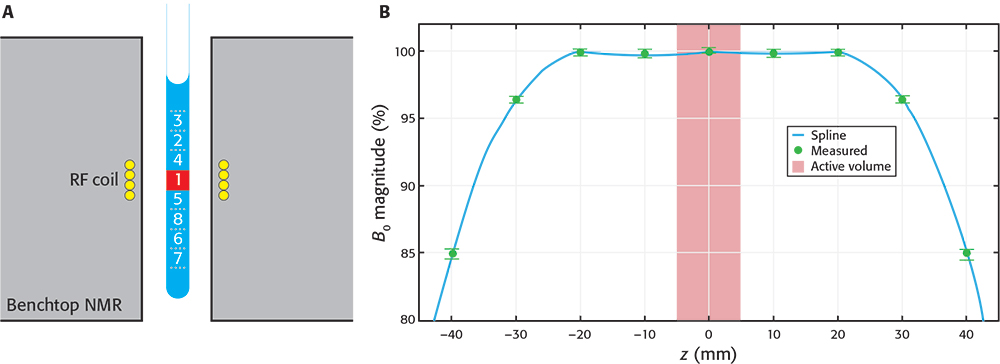
Figure 1. A) Schematic drawing of a sample inside a BT spectrometer. The “active volume” (red square) represents a small portion of the sample, but many similar portions are still strongly polarised by the magnetic field. By a synchronised, downwards shifting of the sample after the first scan the already polarised sub-sample 2 enters the active volume ready to be measured. The process is repeated with other volumes in consecutive scans. B) Profile of magnetic field magnitude along the axis of the spectrometer. Values were measured (green circles) relative to magnitude at the centre. Data were interpolated using a cubic spline (blue line) to aid visualisation. The number of sub-samples capable of being used depends on the BT-NMR model. A shows the maximum number of sub-samples used in this work (8) and the numbers represent the sequence in which the sub-samples are cycled through the active volume.
The idea behind the technique described here is to increase the effective length of an inter-scan relaxation delay by a synchronised shifting of the sample between scans. The shifting introduces a new, polarised portion of the sample into the detection region of the spectrometer. This can serve to enhance SNR for a fixed duration of an experiment in two different ways. Either by collecting more scans (while keeping the same relaxation delay) or acquiring a fixed number of scans and taking advantage of having the sample closer to the equilibrium state in the consecutive scans.
We built a first SWAPE prototype to test the idea on a Spinsolve Carbon benchtop spectrometer (Magritek, Aachen, Germany). The sample is mechanically shifted along the vertical direction by means of a stepper motor mounted on a specially designed surface. The prototype has a low fabrication cost, it does not require modification of the BT-NMR spectrometer and is easily mounted on and off. Synchronisation was achieved by writing the instructions for the stepper motor driver directly into the pulse programmer of the SpinsolveExpert software. We first used the prototype to make essential calibrations, such as measuring the magnetic field profile shown in Figure 1B. Other important calibrations are described elsewhere.3 All measurements shown in this article were acquired using standard 9” Norell 5 mm NMR tubes and sample volumes of approximately 2.7 mL. Sample volume is thus slightly larger than usually required, but it ensures appropriate shimming when cycling through the sub-samples.
Experimental
To demonstrate the potential of the method, we prepared the equimolar (1 mM) mixture of sodium trimethylsilyl-propanesulfonate (DSS, Armar Isotopes, 99 %) and glycine (Sigma-Aldrich, ≥99 %) in D2O. Then, we transferred 2.7 mL of the sample to 5 mm 9” NMR tube (Norell). We mounted the SWAPE prototype on the Magritek Carbon 43 MHz spectrometer and performed shimming using Spinsolve software. The rest of calibrations (transmitter frequency calibration and locking) and the experiments were carried out through Spinsolve Expert software. The two 1H NMR experiments were performed using the same acquisition parameters, except for the fact that one was run for the static sample and the other employed SWAPE for synchronised shifting of the sample during measurement. We used 90° excitation pulse, an acquisition time of 2.458 s and a scan repetition time of 3.125 s for collection of 1600 scans per each experiment. For the SWAPE experiment, we virtually divided the sample into eight regions as shown in Figure 1. The cycling between those regions was performed following the sequence shown in Figure 1, and starting again with the region labelled as “1” after the region “8” is measured. We also acquired a single scan spectrum with the same acquisition parameters to underline a demand for a multi-scan experiment for the studied sample.
Results
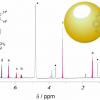
Here we present how using SWAPE can improve the SNR in multi-scan 1H NMR experiments. It is especially beneficial for low-concentration samples, where many scans are required to obtain sufficient SNR. A single-scan NMR spectrum of the studied sample is presented in Figure 2. The dominant signal comes from the residual H2O, whereas the peak of DSS is barely visible and the peak of glycine is missing completely.
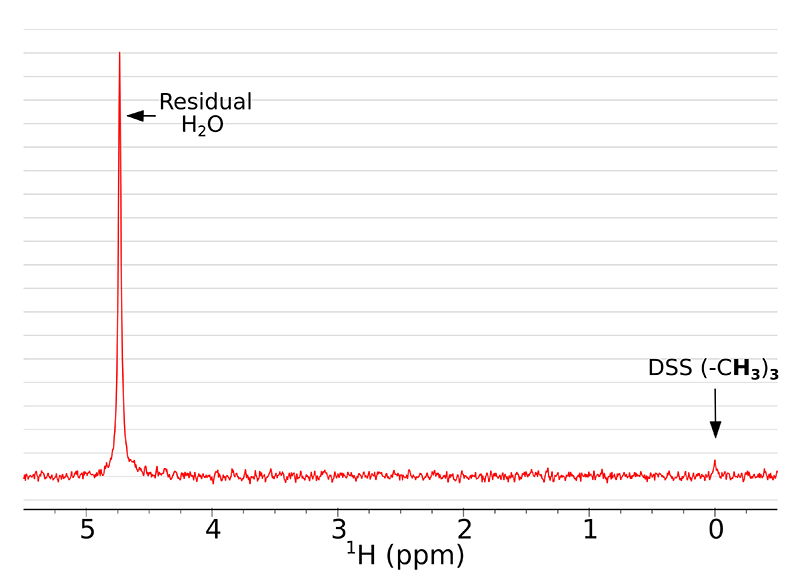
Figure 2. A single scan 1H NMR spectrum of the studied sample with exponentially decaying weighting function (0.2 Hz) applied.
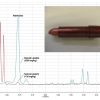
The collection and averaging of 1600 scans help to improve SNR, but employing SWAPE can improve SNR even more. Figure 3 shows how peaks of residual water, DSS and glycine are enhanced with SWAPE compared to the conventional (static sample) acquisition. From panels A and B one may read-out a more than three-fold signal enhancement for residual water, almost three-fold enhancement for glycine (panels C, D) and more than two-fold enhancement for DSS (panels C, D). The enhancement factor relies mainly on the T1 relaxation time of the observed nuclei. The longer T1 is, the better SNR enhancement is expected. At this point, it is worth mentioning a well-known method of using Ernst angle nutation for SNR enhancement in multi-scan experiments.4 Compared to the SWAPE experiment, the main drawback of employing Ernst angle is that prior knowledge of T1 time constants is required to calculate proper pulse length, while SWAPE usually performs best with standard 90° pulse excitation. For samples of low concentration, as in our case, measuring T1 relaxation times would be very time consuming and hardly possible. Moreover, using an optimal nutation angle sets a compromise between overall SNR yield and loss of magnetisation in the consecutive scans, which means that the resulting spectra are rarely quantitative. In the SWAPE acquisition, scan repetition time may be short (3.125 s in our case), but there is a negligible suppression of the z-component magnetisation in the consecutive scans. In the presented case, the true relaxation delay for the excited sample volume is 25 s (8 × 3.125 s), where 8 stands for a number of different sample regions in the NMR tube exploited for a cyclic sample shifting.
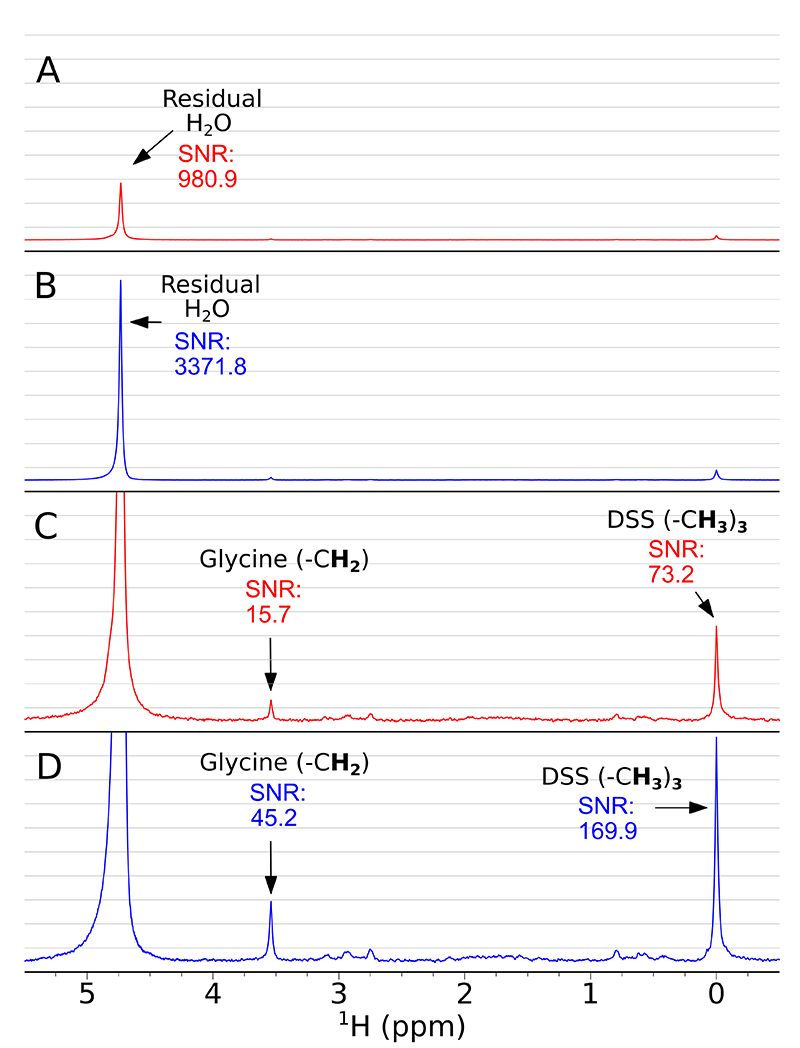
Figure 3. Accumulative 1H spectra (1600 scans) acquired conventionally (red) and using SWAPE (blue). Panels A and B show spectra indicating SNR of residual water peak in conventional (A) and SWAPE (B) experiments. Panels C and D are spectra from A and B accordingly but scaled up. They indicate SNR of Glycine CH2 peak and DSS (CH3)3 peak in conventional (C) and SWAPE experiments (D). Both spectra (red and blue) were weighted with exponentially decaying function (0.2 Hz).
Although not presented here, increasing the true relaxation delay by a factor of eight with SWAPE helps in obtaining the meaningful peak integrals (as they occur in a single scan NMR or experiments with long relaxation delays—typically 5 T1). For the examples and discussion on the improved quantitative capabilities in BT-NMR using SWAPE and improved acquisition of 13C experiments please see our previous article.3 The examples here and in the previous work are all 1D NMR spectra, but SWAPE can also improve the collection of 2D NMR data as well.
Conclusions
In this short note, we presented the general idea behind the method and the performance of the SWAPE prototype in enhancing 1H NMR signals of low concentration chemical compounds. We showed that some signals may be enhanced up to several times, but the enhancement factor is specific for different chemical species and depends on T1 relaxation times. As the method is simple to use and provides much improvement in SNR and quantitative experiments, we believe that it may help improve the general performance of the BT-NMR in many laboratories.
If you want to try out SWAPE in your lab, please contact us!
References
- D.W. Lachenmeier, M. Gary, Y.B. Monakhova, T. Kuballa and G. Mildau “Rapid NMR screening of total aldehydes to detect oxidative rancidity in vegetable oils and decorative cosmetics”, Spectroscopy Europe 22(6), 11–14 (2010). https://www.spectroscopyeurope.com/article/rapid-nmr-screening-total-aldehydes-detect-oxidative-rancidity-vegetable-oils-and-decorative
- F. Dalitz, M. Cudaj, M. Maiwald and G. Guthausen, “Process and reaction monitoring by low-field NMR spectroscopy”, Prog. Nucl. Magn. Reson. Spectrosc. 60, 52–70 (2012). https://doi.org/10.1016/j.pnmrs.2011.11.003
- J.A. Romero, K. Kazimierczuk and D. Gołowicz, “Enhancing benchtop NMR spectroscopy by means of sample shifting”, Analyst 145, 7406–7411 (2020). https://doi.org/10.1039/D0AN01556C
- R.R. Ernst and W.A. Anderson, “Application of Fourier transform spectroscopy to magnetic resonance”, Rev. Sci. Instrum. 37, 93 (1966). https://doi.org/10.1063/1.1719961

Javier A. Romero
Javier A. Romero was awarded a PhD degree in Physics by the National University of Córdoba (Argentina) in 2018. His doctoral research in NMR encompassed the development of a Fast-Field-Cycling MRI prototype. Since 2019 he has worked in the laboratory of NMR spectroscopy led by dr. hab. Krzysztof Kazimierczuk on developing new tools for multidimensional spectroscopy. 0000-0001-8378-3837
[email protected]

Damien Jeannerat
Krzysztof Kazimierczuk got his PhD degree in Chemistry from the University of Warsaw in 2009. His research interests include various novel NMR methods: sparsely sampled, time-resolved, diffusion-ordered and pure-shift spectroscopy. Prof. Kazimierczuk works at the Centre of New Technologies, University of Warsaw. 0000-0001-9585-1737
[email protected]
Dariusz Gołowicz
Dariusz Gołowicz, MSc, graduated with honours from the University of Warsaw (UW) in 2016 in Physical Chemistry. Currently, he is a PhD student in a group of professor Krzysztof Kazimierczuk at the Centre of New Technologies UW. His research focuses on the development of NMR methods with a strong emphasis on the utilisation of non-uniform sampling and non-standard signal processing strategies. 0000-0002-3602-4069
[email protected]