Stéphane Balayssac,a Véronique Gilard,a Marc-André Delsucb and Myriam Malet-Martinoa
aUniversité de Toulouse, UPS, Laboratoire de Synthèse et Physico-Chimie de Molécules d’Intérêt Biologique (SPCMIB), Groupe de RMN Biomédicale, 118 route de Narbonne, 31062 Toulouse cedex 9, France
bInstitut de Génétique et de Biologie Moléculaire et Cellulaire (IGBMC), 1 rue Laurent Fries, BP 10142, 67404 Illkirch, France
Introduction
The capability of nuclear magnetic resonance (NMR) spectroscopy to provide valuable information regarding mixture analysis has created broad applicability in chemistry, biochemistry, biology and medicine. As drugs can be considered to be complex mixtures (composed of many different substances and/or including simultaneously high and very low quantities of compounds), NMR is a good tool for studying such formulations. Unfortunately, NMR has traditionally been sensitivity-limited compared with many other analytical techniques. Nevertheless, technological advancements in the field of magnetic resonance have made significant strides in improving sensitivity levels, developing new acquisition/processing tools and implementing innovative NMR experiments/pulse sequences.
For a long time it has been preferred, when possible, to isolate each mixture component prior to its study by NMR rather than to analyse the whole mixture. For most scientists, the preferred methods for mixture analysis and/or trace detection are still the chromatographic methods, generally coupled with spectroscopic methods such as mass spectrometry or NMR. LC-NMR, in which the NMR spectrometer acts as a high performance liquid chromatography (HPLC) detector, has been developed on this basis. But there is indeed “a pure NMR” method that allows a precise analysis of a complex mixture without any prior separation of the different components: the Diffusion Ordered SpectroscopY (DOSY) method.1 Furthermore, DOSY experiments do not need complicated setups and the method can be easily standardised and automated. One should also keep in mind the non-destructive nature of NMR spectroscopy.
The DOSY method allows measuring the translational self-diffusion of molecules in a solution. Based on the analysis of mono- and multi-exponential decays, spectra of mixture components can be separated depending on the value of their apparent diffusion coefficients. Diffusion measurement by NMR and especially the DOSY-type experiments are thus powerful analytical tools, which have so far been overlooked by most scientists.
This article outlines the use of the DOSY NMR method applied to drug analysis and screening for counterfeit drugs or fake herbal medicines.
Experiments
The 1H NMR experiments were performed on a Bruker Avance 500 spectrometer operating at 500.13 MHz. Solutions for NMR analyses of medicines were prepared as follows: tablets were powdered or capsules emptied and the powder was resuspended in 5 mL of deuterated NMR solvent; the suspension was then centrifuged and the supernatant analysed. The solvent used was a mixture of acetonitrile-d3 (CD3CN) : heavy water (D2O) (80 : 20) for herbal medicines or dimethylsulphoxide-d6 (DMSO-d6) for genuine and fake artesunate. All chemical shifts (d) referred to an internal trimethylsilylpropane sulphonic acid (TMPS) reference.
For 2D DOSY 1H NMR, stimulated echo bipolar gradient pulse experiments were used with a pulse delay of 3 ms after each gradient, a pulse field gradient length of 1–2 ms depending on experiments and a diffusion delay of around 100–150 ms. All data were processed with the NPK software, which implements inverse Laplace transform method using the Maximum Entropy (MaxEnt) algorithm. The 3D DOSY-COSY acquisition was recorded on fake artesunate formulations. 2D COSY (COrrelation SpectroscopY) and DOSY experiments were acquired with DQF-COSY iDOSY parameters. These 3D experiments were processed using the NPK software and all experiments analysed with the NMRnotebook package.2
Principle of DOSY NMR
A basic presentation of the 2D DOSY NMR experiment can be obtained with reference to Figure 1. DOSY NMR is a two-dimensional NMR experiment; one dimension accounts for conventional chemical shifts and the other for diffusion coefficients. The use of NMR for measuring the self-diffusion coefficients of molecules in solutions is based on a pulsed field gradient (PFG) stimulated spin-echo (STE) experiment. Typically, a series of 1D PFG-STE experiments is acquired with systematic variations of the gradient pulse amplitude (Figure 1A). The rate of signal decay is directly related to the diffusion coefficient D of the molecule, which depends on the molecular weight and other hydrodynamic properties (size, shape, charge) as well as on its surrounding environment (temperature, aggregation state). The diffusion coefficient can thus be estimated by analysis of the exponential signal decay. Signals from small molecules (large D) decay more rapidly than those from large molecules (small D) as the pulsed field gradient is incremented (Figures 1A and 1B). The Fourier transformation of the NMR signal and the inverse Laplace transformation of the decaying signals (Figure 1C) lead to the DOSY spectrum: a mixed Fourier–Laplace spectrum on which the chemical shifts (d in ppm) lie on the horizontal axis while the diffusion coefficients are on the orthogonal axis (D in µm2 s–1) (Figure 1D). All signals (spots) belonging to the same species are aligned and the diffusion coefficient can be measured.
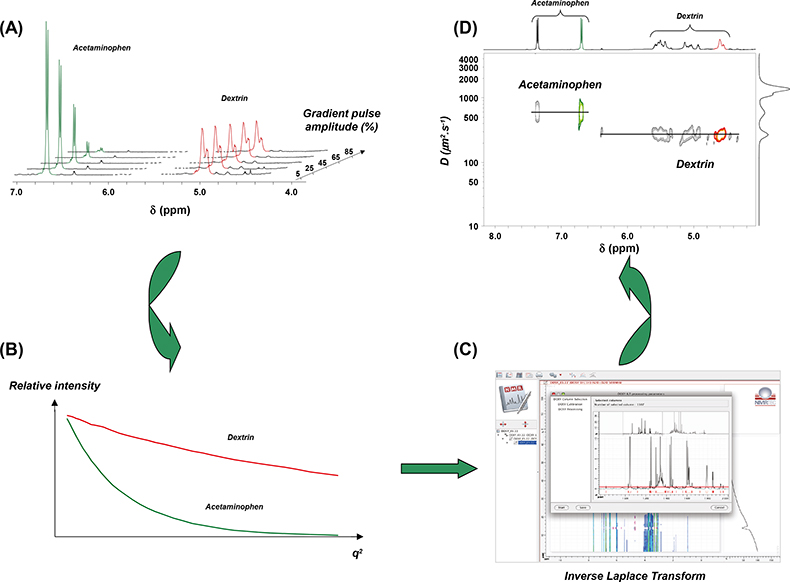
Figure 1. Schematic principle of the DOSY NMR experiment recorded on a fake artesunate formulation. Brownian motion in the liquid results in translational diffusion of the various solutes, and a mean molecule displacement is observed at the end of the diffusion delay (D). (A) PFG-STE experiments at different gradient pulse amplitudes; (B) this displacement has the effect of reducing the signal intensity with an exponential law: I(q) = I0 exp(–DDq2) with q = g g d where D is the diffusion coefficient, g the gyromagnetic ratio, g and d the intensity and the duration of the pulsed field gradient, respectively; (C) data processing using the NMRnotebook package; (D) 2D DOSY 1H NMR spectrum.
Adulterated herbal medicines
Over the last few decades there has been an exponential growth in the field of herbal medicines. They are becoming popularised in developing and developed countries and play an active part in people’s health care. These products are regarded by many as being harmless because of their natural origins, and helpful to the treatment of some chronic diseases and to the maintenance of physical fitness. However, herbal medicines are associated with numerous problems involving their quality and particularly the deliberate use of synthetic drugs in herbal formulations, which is a serious matter for the regulatory bodies and the users alike. Indeed, in order to improve their effects, some manufacturers include synthetic drugs in the formulation process of their products marketed as “herbal medicines” or “dietary supplements”.
Figure 2 shows the DOSY NMR spectra of two formulations which the manufacturer advertised as “all natural” or containing only vitamins. The first formulation (A) was marketed for sexual dysfunction and the second (B) is sold as a natural slimming product; they were manufactured in Taiwan and China, respectively. DOSY NMR has the advantage of allowing the detection of the various components of complex mixtures in a single run. It has allowed the detection of adulteration in both examples without any prior knowledge of the samples’ contents.
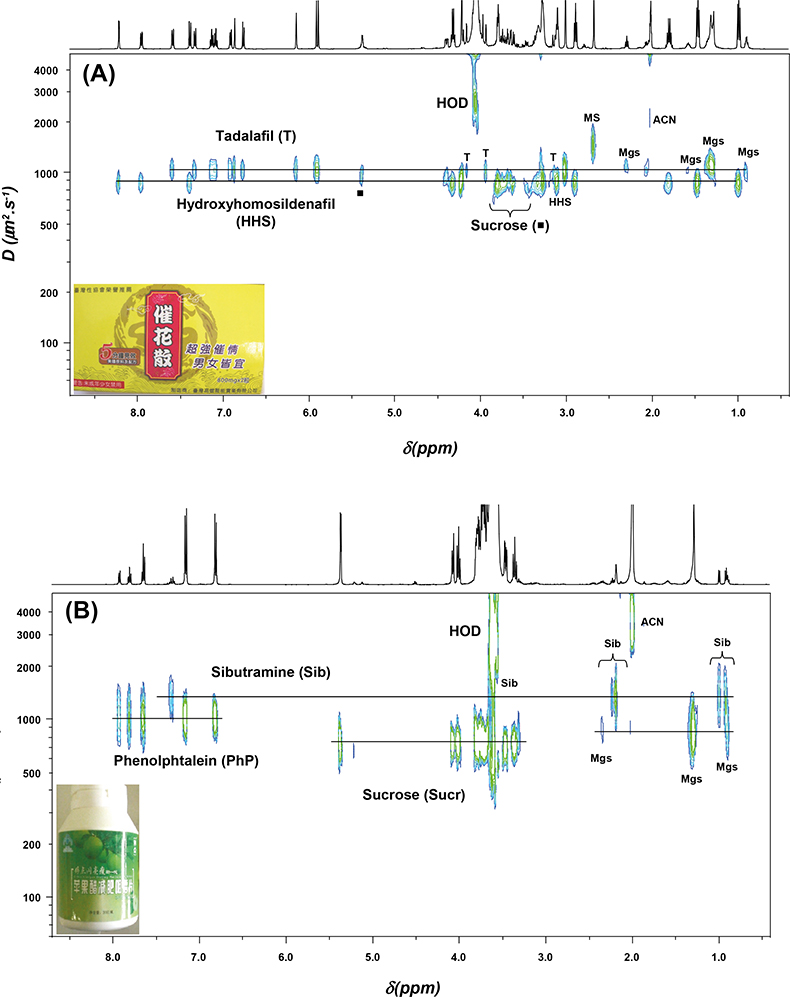
Figure 2. 2D DOSY 1H NMR spectra of two formulations claimed as herbal drugs recorded at 500 MHz in CD3CN : D2O (80 : 20). (A) Formulation manufactured in Taiwan (yellow capsule) adulterated with tadalafil and hydroxyhomosildenafil. (B) Formulation manufactured in China (green tablet) adulterated with sibutramine and phenolphthalein. Mgs: magnesium stearate, MS: methane sulphonate, ACN: deuterated acetonitrile (CD3CN).
Formulation A was adulterated with tadalafil (Cialis®), a synthetic phosphodiesterase-5 (PDE-5) inhibitor drug, and hydroxyhomosildenafil. Indeed, the success of synthetic PDE-5-inhibitor drugs (sildenafil, vardenafil and tadalafil), which are constituents of popular brands (Viagra®, Levitra® and Cialis®, respectively) for the treatment of erectile dysfunction in males, has led to their widespread use as adulterants in herbal dietary supplements.3 Formulation A also contains hydroxyhomosildenafil, a sildenafil analogue. Analogues of PDE-5 inhibitors are structurally close to parent compounds, as modifications involve minor structural changes by substitution of functional groups. Such analogues are difficult to detect by ordinary laboratory methods due to various structural modifications, and they might be used in an attempt to evade regulatory inspection. Other signals detected in formulation A were those of inactive compounds, i.e. sucrose and magnesium stearate (Mgs).
Formulation B, a slimming herbal product, was adulterated with sibutramine, which is an approved drug only available on prescription as an appetite suppressant for the treatment of obesity. Phenolphthalein, another adulterant was also found; it has been used for over a century as a laxative and it is currently being removed from the market due to concerns about carcinogenicity. Inactive ingredients sucrose and magnesium stearate (Mgs) were also detected.
Quantitative data on adulteration can be obtained from the conventional 1D NMR spectrum. Formulation A contains 31 mg of tadalafil that is three times the normal starting dose and 48 mg of hydroxyhomosildenafil for which toxicological data are not known or not available. Formulation B contains 5 mg of sibutramine, lower than the normal starting dose (10 mg) and in addition 36 mg of phenolphthalein.
Genuine and counterfeited antimalarial formulations
The counterfeiting of commercial products (e.g. clothing, watches, software, and medicines) is an ever-increasing worldwide problem. However, the risk to public health from purchasing a counterfeit watch is minimal compared to the risk associated with the use of a counterfeited pharmaceutical product. A wide range of analytical methods can be used in the screening and sourcing of suspect counterfeited drugs, for instance colorimetric methods, HPLC, X-ray diffraction, near infrared (NIR) or Raman spectroscopy. 2D DOSY NMR could now be part of these analytical tools, since the 2D DOSY spectra could be used as easy visual tools to distinguish between genuine and illegal or fake formulations. Indeed, the DOSY spectra clearly show similarities and differences in the composition of drugs’ pharmaceutical formulations, thus giving a signature of the formulation process and eventually of the probable manufacturer.
In Figure 3 are reported the genuine formulation of artesunate and an imitation. Both tablets were manufactured in China. Artesunate is an antimalarial artemisinin derivative developed in the People’s Republic of China, which is vital for malaria treatment. It is widely used as part of mono or combination therapies in South East (SE) Asia and increasingly in Africa for the treatment of Plasmodium falciparum malaria. Its high cost and demand has made it a preferred target for counterfeiters. An estimated 33–53% of artesunate antimalarials sold in mainland SE Asia have been reported to be counterfeit, containing either no or sub-therapeutic quantities of artesunate.4
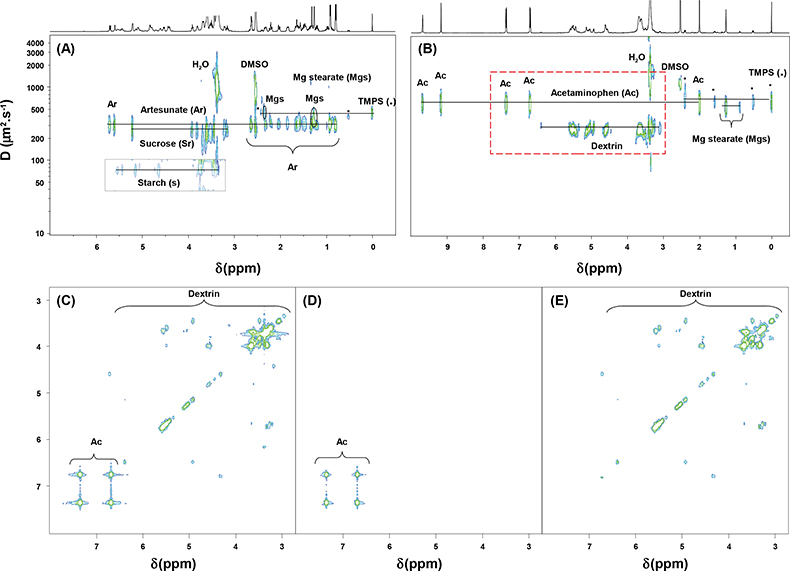
Figure 3. 1H NMR spectra of artesunate formulations recorded at 500 MHz in DMSO-d6. (A) 2D DOSY 1H NMR spectrum of the genuine formulation; (B) 2D DOSY 1H NMR spectrum of a fake formulation; (C) COSY-DQF spectrum of the fake formulation; COSY extractions from the 3D DOSY-COSY experiment on the fake formulation at (D) 630 µm2 s–1 and (E) 260 µm2 s–1 [red dashed line rectangle in (B)].
2D DOSY 1H NMR allows one to prove easily that the tablets’ compositions are different. The genuine formulation (Figure 3A) contains artesunate, starch and sucrose as tablet diluents and magnesium stearate as tablet lubricant. The counterfeit formulation content is a far cry from the genuine one (Figure 3B); indeed it contains a wrong active pharmaceutical ingredient, in this case acetaminophen (paracetamol), which is an active and widely-used analgesic and antipyretic pharmaceutical ingredient. Furthermore dextrin has been identified as the tablet diluent used in this fake formulation. Figure 3 highlights the interest of using 2D DOSY and 3D DOSY-COSY as complementary methods for, first, the identification of fake formulations by DOSY NMR spectra and then the structural identification of wrong active pharmaceutical ingredients that have been added. On the full COSY spectrum (Figure 3C), diagonal signals and off-diagonal cross peaks of paracetamol and dextrin are observed. The other spectra (Figures 3D and 3E) are those of the projections from the 3D DOSY-COSY experiment. These COSY spectra were extracted for each component of the mixture from a selected line in the DOSY spectrum. The COSY projections of paracetamol and dextrin were extracted at a diffusion coefficient (D) of 630 µm2 s–1 and 260 µm2 s–1, respectively. By using the three-dimensional NMR experiment package, structural information on unknown components can be deftly obtained from a complex mixture without any prior purification or chromatographic separation.
Conclusion
Ensuring the quality of medicines is becoming more important and challenging. This means that the pharmaceutical analyst needs more techniques to fulfill his duty. We think that, in addition to traditional techniques, DOSY could now be part of the “analytical toolbox” of any spectroscopist dealing with complex mixture analyses in pharmaceuticals, especially analysts investigating quality control, counterfeiting and smuggling. Moreover, this technique may be helpful in determining the relationships between different samples and so assist in the investigation of the sources of these drugs. Indeed, DOSY spectra clearly show similarities and differences in the compositions of pharmaceutical preparations, thus giving a chemical fingerprint of the formulation and a signature of the manufacturer. This spectral signature includes not only the active pharmaceutical ingredient(s) but also the excipients.5
The analytical methods that provide most information on excipient compositions are solid state methods such as Raman spectroscopy, NIR spectroscopy or X-ray diffraction, whereas chromatographic methods allow an accurate identification of active pharmaceutical ingredients but do not give information on excipients. DOSY NMR is a holistic method that allows for considering the drug preparation as a whole, providing information on both active compounds and excipients. In the case of adulterated herbal medicines analyses, the identity of the components is not known beforehand and 2D DOSY 1H NMR spectroscopy is therefore a powerful method for providing the multivariate fingerprint.6 The technique should now be considered as a useful and complementary tool in a standard 2D NMR analytical package. Moreover, its evolution towards 3D DOSY-COSY experiments noticeably increases its interest as structural data are easily obtained.
Acknowledgements
The authors wish to thank Dr Facundo Fernandez (Georgia Institute of Technology, Atlanta, 0USA) and Dr Paul Newton (Churchill Hospital, Oxford University, Oxford, UK) for providing artesunate samples and for helpful discussions on antimalarial drugs.
References
- K.F. Morris and C.S. Johnson Jr, J. Am. Chem. Soc. 114, 3139–3141 (1992). https://doi.org/10.1021/ja00034a071
- NMRtec. Available from http://www.nmrtec.com.
- S. Singh, B. Prasad, A.A. Savaliya, R.P. Shah, V.M. Gohil and A. Kaur, Trends Anal. Chem. 28, 13–28 (2009). https://doi.org/10.1016/j.trac.2008.09.004
- P.N. Newton, F.M. Fernandez, A. Plancon, D.C. Mildenhall, M.D. Green, L. Ziyong, E.M. Christophel, S. Phanouvong, S. Howells, E. McIntosh, P. Laurin, N. Blum, C.Y. Hampton, K. Faure, L. Nyadong, C.W. Soong, B. Santoso, W. Zhiguang, J. Newton and K. Palmer, PLoS Med. 5, e32 (2008). https://doi.org/10.1371/journal.pmed.0050032
- S. Trefi, C. Routaboul, S. Hamieh, V. Gilard, M. Malet-Martino, R. Martino, J. Pharm. Biomed. Anal. 47, 103–113 (2008). https://doi.org/10.1016/j.jpba.2007.12.033
- S. Balayssac, S. Trefi, V. Gilard, M. Malet-Martino, R. Martino and M.A. Delsuc, J. Pharm. Biomed. Anal. in press (2008), https://doi: 10.1016/j.jpba.2008.10.034


