Frederick W. Koehler IV, Eunah Lee, Linda H. Kidder and E. Neil Lewis*
Spectral Dimensions, Inc., 3416 Olandwood Ct, Suite 210 Olney, MD 20832, USA. E-mail: [email protected]
Introduction
Chemical imaging spectroscopy is an exciting new analytical advance that answers commonly asked questions such as what chemical species are in a sample, how much of each is present, and most importantly, where are they located? Through the fusion of traditional infrared spectroscopy with powerful microscopic and macroscopic imaging capabilities, chemical imaging spectroscopy answers all these questions simultaneously, in a single rapid measurement.1 Chemical imaging enables the researcher to obtain spatial and spectral information characterising samples with unprecedented ease, speed and spatial and spectral resolution. The methodology is aimed at providing a comprehensive analysis of complex heterogeneous samples.
Chemical imaging has advanced significantly with the commercialisation of infrared focal plane arrays (FPAs), which are cameras composed of many thousands of individual infrared detector elements. When coupled with infrared optics and a means of wavelength selection, these instruments provide an image where varying contrast is derived from the unique infrared chemical signature characteristic of each component within the sample. Powerful statistical and chemometric tools can enhance these chemical maps by performing valuable data reduction steps to identify and extract the most analytically useful information. This can be invaluable to winnow the large volumes of data collected by this technique.
Infrared and near infrared (NIR) imaging, in particular, has the experimental flexibility to characterise a wide variety of samples chemically using transmission and reflectance measurements, while its ability to tackle samples ranging in size from microns to kilometers using microscopes or satellite-based remote sensing systems, makes it truly unique. The large format infrared cameras currently available, particularly in the NIR, provide high image fidelity and coupling these arrays to precise infrared wavelength selection devices with narrow bandpass capabilities including Fourier transform spectrometers1,2 and liquid crystal tunable filters3 make the technique fully hyperspectral. In fact, most commercially available spectral imaging systems have spectral resolutions comparable to those of conventional infrared and NIR spectrometer systems. This type of instrumentation has already started to supplant time-consuming mapping techniques, particularly in the infrared spectral region, in which data is recorded one spectrum at a time and the image is constructed by moving the sample in an x,y pattern under the spectrometer optics. It is likely that infrared array-based imaging approaches will completely replace single-point mapping techniques in the future.
Although we have applied this general hyperspectral imaging approach to tackle a number of biological and industrial problems in the past, and have developed a variety of instruments and methods for mid-infrared, NIR and Raman imaging we will focus in this paper on industrial chemical imaging problems using NIR diffuse reflectance only. We believe that this spectral interval strikes a perfect balance between sensitivity, flexibility, simplicity and ruggedness that makes it an ideal industrial imaging tool. In addition, we will illustrate through several examples the unique features that chemical sensing with array detectors affords. With the application of quantitative data analysis in these examples, we will show it’s not just about pretty pictures.
Foundations of chemical imaging
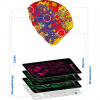
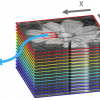
The foundation of chemical imaging is the concept of a chemical map. As shown in Figure 1, a chemical imaging data set is represented by a three-dimensional cube where two axes describe vertical and horizontal spatial dimensions and the third dimension represents the spectral wavelength dimension. Like a deck of cards, there is one image per wavelength interval stacked sequentially. The intensity of a single pixel plotted as a function of the wavelength dimension represents a standard NIR spectrum. Intensities for all pixels at a single wavelength represent an image of absorption at a particular spectral band across the sample. It is the wavelength dimension that visualises chemical specificity by segregating different chemical species to different spectral regions of the chemical image cube.
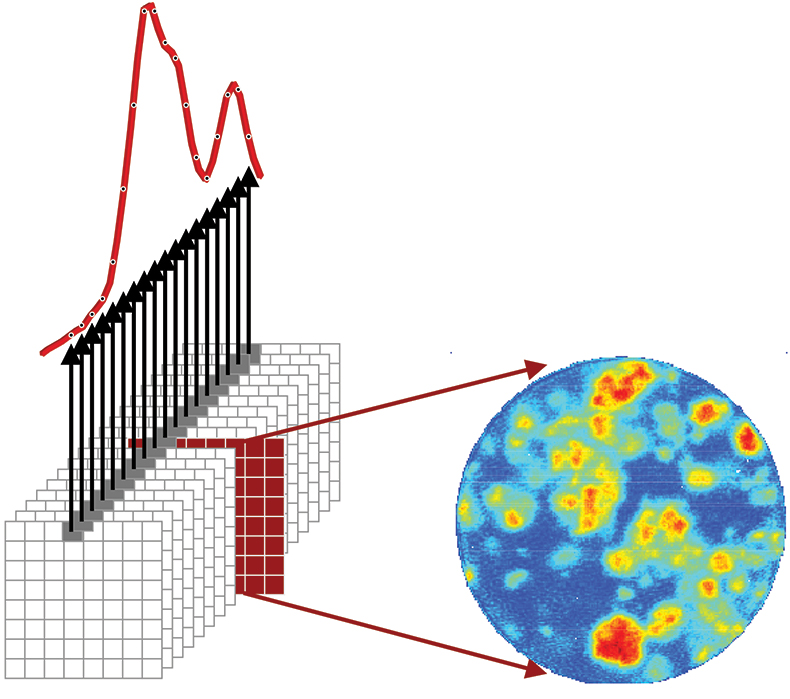
Figure 1. Infrared chemical imaging data cube of a finished pharmaceutical product. The single pixel spectrum shown corresponds to intensity as a function of wavelength at a fixed spatial location and provides the spectral signature of chemical components present in that part of the sample. The single channel image shown corresponds to intensity for all pixels at a fixed wavelength. This carries information about the spatial distribution of a chemical component with a distinguishable spectral signature at that wavelength.
A variety of analytical techniques can be used to visualise and process chemical image data sets. Simple grey scale chemical maps can be constructed from a single image plane. For more detailed contrast, mapping individual image planes onto red, green and blue (RGB) channels can create composite colour chemical images. Individual chemical images can be ratioed against each other to normalise for pathlength effects or to perform spectral normalisation and further isolate components of interest. These types of univariate approaches work well for species with unique spectral signatures. For cases with significant spectral overlap, common in NIR, or when the maximum signal to noise ratio is required, statistical and chemometric approaches such as principal component analysis (PCA) or partial least squares (PLS) regression can be utilised. Additionally, after isolating spectral information unique to the sample of interest, standard image processing approaches can be applied and statistical analysis performed to characterise numbers of particles, their size and relative concentration.
Why NIR imaging?
Conventional NIR spectroscopy is a widely adopted method for performing analytical measurements. It has become the obvious choice in many industrial applications because it provides both qualitative and, in particular, quantitative results non-destructively on solids and liquids in reflectance or transmittance mode. In many cases sample preparation is minimal or non-existent, making the method extremely userfriendly and rapid. In addition, the optical systems (sources, detectors, lenses, fibre optics etc.) are rugged, exhibit high-performance and are readily available, resulting in a practical technique for widespread use inside and outside of highly regulated laboratory environments. Just like its older, conventional NIR cousin, NIR chemical imaging (NIR-CI) retains all of these advantages and gains several more through the addition of spatial dimensions and parallel data collection. In recent years it has become an extremely powerful adjunct to NIR spectroscopy in a number of different ways.
For example, in contrast to traditional spectroscopic techniques which analyse the sample in bulk and determine an average composition across the entire sample, individual detector elements in a chemical imaging array can detect spatially isolated minor chemical species. Because the data is collected in parallel the result is not hampered by a “dilution” effect in the same way a single spectral bulk measurement would, and trace sample contamination measurements can be made extremely rapidly. While this problem is also tractable using conventional micromapping spectrometers, due to lengthy data collection times, these approaches quickly become impractical for routine work.
Recent advances in chemometric factor analysis approaches have identified another interesting property of array-based chemical sensing which enables quantitative information to be obtained without running separate calibration samples. The techniques take advantage of the large numbers of individual spectra recorded in a typical image cube and utilise the inherent spectral variance across the spatial dimension of heterogeneous samples to obtain pure component spectral estimates. These spectral estimates provide the basis from which relative concentrations can be determined for each spatial location. The entire process of pure component determination and concentration estimation can be derived from a single imaging experiment.
While NIR-CI may appear at first sight not to have the analytical specificity of mid-infrared (MIR) imaging or the spatial resolution of Raman imaging, in many real-world situations, it outperforms them both. It does this by taking advantage of the same unique qualities that traditional NIR spectroscopy offers over these same techniques. For example, whilst providing a degree of spatial resolution, which is better than that of mid-infrared imaging systems and competitive with Raman systems, when coupled to a microscope, it can also be readily adapted to a wide variety of fields-of-view (FOV). Global Raman imaging quickly runs out of steam in the case where larger FOVs are desired because of the inability to flood these areas with sufficient laser power. Mid-infrared imaging is hampered by the fact that all commercially available systems collect data by spectrally modulating infrared energy from the source and do not filter the image. This rules out the possibility of using multiple sources to address the ever-increasing power densities required to illuminate larger FOVs. The single globar in a typical FT-IR system was not designed for spectral imaging and is unlikely to provide the necessary energy. While both mid-infrared (MIR) imaging and Raman imaging perform well as micro techniques, they quickly run into difficulty imaging samples much larger than a few millimetres. Because NIR-CI uses relatively simple quartz-tungsten-halogen (QTH) sources, and an image filtering, not a source filtering approach, wide-field illumination for a variety of magnifications and imaging modes is relatively trivial. Both infrared and Raman mapping approaches can deal with this FOV issue, but the data collection time is generally not acceptable.
NIR-CI is also free of the need for the very flat samples necessary for global Raman imaging. This flatness requirement is imposed by the limited depth-of-field of a global Raman imaging experiment as a direct result of the necessity to use very high numerical aperture objectives to collect the limited amount of signal available. A similar sampling limitation is also encountered in MIR imaging for different reasons. In most cases the reflectance mode has proven to be energy limited, suffering from a poor signal-to-noise ratio and requiring extended periods of data collection time. Therefore, the overwhelming body of MIR imaging data published to date has been recorded in transmittance mode. This requires the samples to be sectioned and, like the global Raman imaging measurement, optically flat. These issues have limited the general applicability and scope of both of these imaging approaches. On the other hand, NIR imaging systems perform particularly well in reflectance mode. Because of the excellent noise characteristics of the NIR arrays and the abundant optical signal available, these systems can be designed without the need for high collection efficiency imaging optics and consequently exhibit large depths-of-field. This design philosophy provides extreme tolerance to variations in sample geometry allowing most NIR chemical imaging experiments to be performed on very irregular samples without sample preparation.
Analytical targets
NIR-CI analysis not only makes the qualitative determination that particular species are present in the sample, but also visualises the spatial distribution of these chemical species throughout the sample. For many materials, both manmade and naturally occurring, the degree of chemical heterogeneity within any given sample is itself a critical functional parameter not easily measured via standard analytical approaches. Analogous to parallel computer processing, the array detector collects spectral data in parallel, allowing NIR-CI to investigate multiple samples simultaneously. Using this approach any differences between individual samples are readily identified using unsupervised statistical approaches.Samples that benefit from NIR-CI fall into several categories with the analytical goal being slightly different for each. For mixtures in which the distribution of individual species in the sample is largely random, and doesn’t affect the functionality, a typical analytical goal is often the rapid determination of the relative abundance of each species in the mixture. In other cases the sample may be assumed to be largely homogeneous with a need to screen and identify contaminants. An example of this latter application is screening cattle feed for animal protein contaminants and will be covered in the article. For samples in which the spatial distribution of the components in a mixture is critical for functionality, the analytical goal may be to correlate physical properties with this chemical heterogeneity. Pharmaceuticals fall into this category and the chemical morphology of these materials can dictate properties such as dissolution rate and therefore potency. This will be the subject of a second example application.
Biological tissues, both plant and animal, are by far the most complex examples of materials which are both chemically and spatially complex. Biology is mediated across spatial chemical gradients and cannot function unless this complex structural framework is intact. These materials also make excellent examples of the utility of chemical imaging.
Experimental protocol
The imaging data used in the following examples were recorded in diffuse reflectance mode using a commercially available NIR-CI spectrometer (MatrixNIR, Spectral Dimensions, Inc., Olney, MD, USA) tuning over the wavelength range 1050–1700 nm with a spectral point spacing of 10 nm. This particular imaging system utilises an indium gallium arsenide (InGaAs) FPA detector consisting of 240 × 320 pixels for a total of 76,800 spectra per image cube recorded with approximately one minute of data acquisition time. A standard personal computer running the Windows 2000TM operating system was employed for data collection and analysis (IsysTM, Spectral Dimensions, Inc., Olney, MD, USA). A second data set consisting of a reflectance standard was collected in each case and used as a background. Data is presented as log10(1/R) units computed through an inverse log transform after dividing the sample data set with the background image cube.
Quantitative assessment of pharmaceutical formulations
In our first example, NIR-CI is used to visualise and quantify the spatial distribution of the active pharmaceutical ingredient (API) in an over the counter (OTC) child’s pain medication tablet. Figure 2(a) consists of a visible image taken of this tablet and demonstrates the relative uniformity of the sample surface under visible illumination. Using an unsupervised principal component analysis (PCA) technique to examine the NIR imaging data, spectral variations between the API and excipient are automatically identified and exploited to generate image contrast. The principal component image shown in Figure 2(b) highlights spatial locations with similar spectral signatures by assigning them similar scores and therefore similar contrast. It follows that regions with similar spectral signatures will also have similar chemical composition and in this particular chemical map, red pixels indicate drug rich regions and blue pixels represent the surrounding matrix of excipient components. While the image highlights the high degree of chemical heterogeneity of this particular formulation, it is purely qualitative and does not provide any quantitative information, or any pure component spectra.
Further analysis was carried out by spatially isolating only those pixels corresponding to the tablet (31,683 total), calculating their second derivative spectra and performing an alternating least squares analysis (ALS).4 Using this approach an estimation of the spectra of the pure chemical components and their relative abundance in the formulation can be determined without the need to collect spectra of standard reference materials. Figure 2(c) shows the calculated pure component NIR spectra after performing ALS for the API (blue line) and the bulk excipient mixture (red line). Initial estimates of the pure component spectra were derived from a principal component analysis on these derivative spectra.
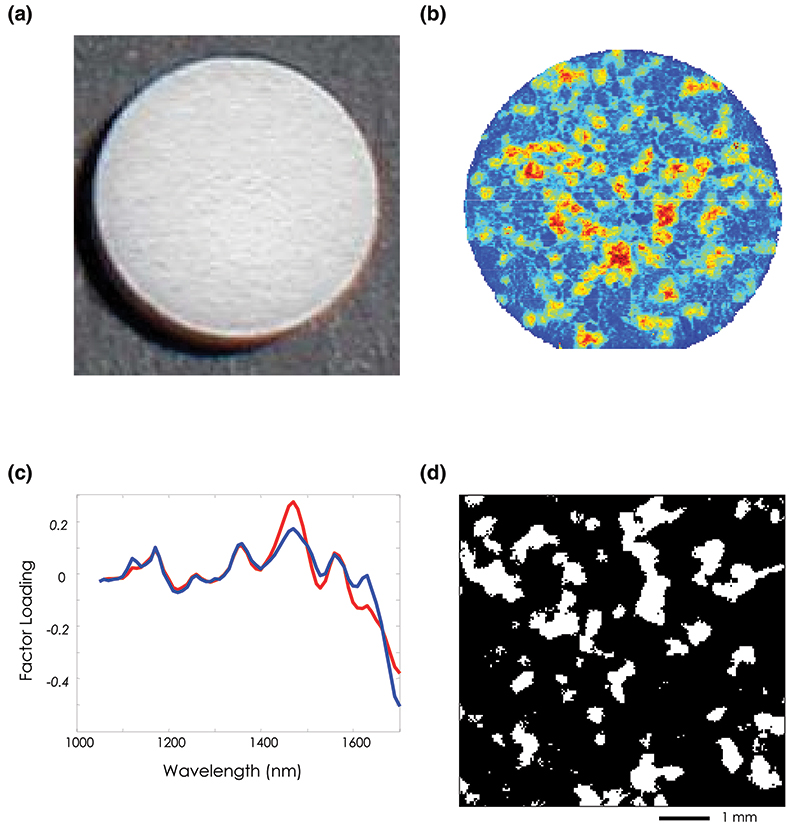
Figure 2. (a) Visible image of an over-the-counter plain medication tablet. (b) PCA score plot for factor 3. (c) ALS “pure” component loading spectra for the API and Excipient mixture. (d) Concentration estimate image. White pixels represent the API with an estimated bulk concentration of 19.38 %.
These pure component spectra can be used to generate concentration estimates for each analyte at every spatial location. Figure 2(d) shows the corresponding API concentration distribution image calculated for all 31,683 spatial locations. The white regions represent areas rich in the API and the black pixels correspond to domains of the excipient mixture. The total number of pixels assigned to API is 6140 corresponding to a bulk concentration estimate of 19.38 % [(6140 / 31,683) × 100]. This result compares favourably with the 20 % concentration by weight reported by the manufacturer.
High-throughput screening of biological material
New regulations imposed attempting to contain the spread of Bovine Spongiform Encephalopathy, BSE, in farm animals, and ultimately the human population, have mandated that the composition of animal feed be more strictly controlled. In particular, because the disease is postulated to be spread by ingesting proteins from other slaughtered, and potentially diseased, animals, the amount of animal protein present in animal feedstocks must not exceed 0.1 %. Therefore, a critical need exists to rapidly screen and identify low levels of animal protein contamination in bulk feed.
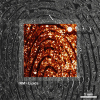
Figure 3(a) shows a bright field image of an 8.5 mg sample of cattle feed contaminated with poultry by-product at approximately 1 % concentration by weight. This image lacks intrinsic contrast between the individual particles making it extremely difficult to identify visually the presence or absence of the contaminant. Figure 3(c) on the other hand shows a NIR chemical image of the same group of particles where the contaminant is clearly identified. This data set was collected in a manner identical to the pharmaceutical application but a supervised data processing approach was employed. Spectra to be used as a calibration set were collected of samples corresponding to “pure” cattle feed and “pure” poultry by-product. The term “pure” here does not refer to a pure chemical species since each component is a complex aggregate from many different sources. The calibration set for each component was extracted from a single image data set that spanned the chemical variation in each of the pure samples. Figure 3(b) shows the mean spectrum for each of the components. Figure 3(c) shows the result of performing a partial least squares (PLS) prediction on the mixture image data set using a model computed with this calibration set where each component concentration was set to unity. The resulting concentration image map highlights regions of the mixture that are rich in the poultry by-product. In this example, the red particle is unequivocally identified as belonging to the poultry class, while the yellow particles are identified as “suspicious” and may contain some lower fraction of poultry contamination. Blue particles are identified as belonging to the cattle feed class and would be considered harmless. From a simple calculation of the area occupied by the contaminant particle relative to the total area covered by all the particles we arrive at a statistical estimate of 1.5 % for poultry contamination. This is in relatively good agreement with the actual value of 1 %.
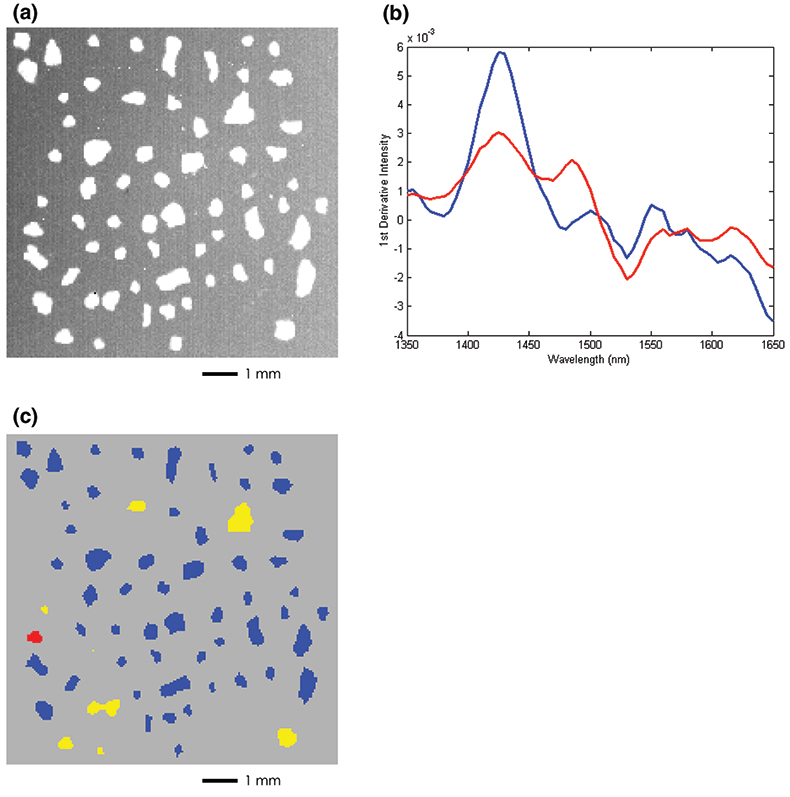
Figure 3. (a) Bright field image of cattle feed particles with 1 % (wt/wt) poultry by-product contamination. (b) Pure component training spectra of cattle feed (blue) and poultry by-product (red). (c) PLS concentration image calculated with respect to the poultry by-product class. The red particle is assigned to the poultry by-product while the yellow particles show regions of intermiediate concentration. Blue particles are classified as pure cattle feed.
This application represents an example where the focus is not imaging or characterising spatial heterogeneity, but rather high-throughput screening. The large number of individual NIR detectors (76,800) on a typical array and the variable FOV of this particular NIR imaging system enables hundreds or even thousands of particles to be screened simultaneously. In essence, the instrument performs like hundreds of microspectrometers all operating in parallel, each one responsible for establishing the origin of a discrete particle in the mixture. This process provides an enormous throughput advantage and a corresponding increase in sensitivity over traditional bulk spectroscopic or microspectroscopic approaches. While the data presented in this example was recorded in approximately one minute more recent studies have indicated that this type of discrimination might be possible on many more particles at significantly higher speeds.
Conclusions
Infrared arrays and chemical imaging represent a major enhancement to the capabilities of conventional infrared and NIR spectroscopy through the introduction of spatial dimensions and parallel data collection. Advanced chemometric, statistical and image analysis routines are available which can enhance the chemical image data collected to obtain concise results as intuitive to interpret as viewing a picture. Further, this information can be used to characterise the abundance, distribution and mean size of the chemical domains present in complex heterogeneous samples. This information is often the key to understanding the bulk physical properties of many manufactured materials and hence how these parameters affect their intended functionality.
Acknowledgements
The authors would like to thank Dr Ishiguro of the Japanese Ministry of Agriculture for providing the samples of cattle feed used in the study.
References
- E.N. Lewis, P.J. Treado, R.C. Reeder, G.M. Story, A.E. Dowrey, C. Marcott and I.W. Levin, Anal. Chem. 67, 337 (1995).
- L.H. Kidder, I.W. Levin, E.N. Lewis, V.D. Kleiman and E.J. Heilweil, Opt. Lett. 22, 742 (1997).
- E.N. Lewis, J.E. Carroll, F. Clarke, NIR news 12(3), 16 (2001).
- R. Tauler, A. Smilde, B. Kowalski, J. Chemometr. 9, 31 (1995).