Lukas K. Bittner, Stefan A. Schönbichler, Verena Huck-Pezzei, Johannes D. Pallua, Christine Pezzei, Günther K. Bonn and Christian W. Huck*
Institute of Analytical Chemistry and Radiochemistry, Leopold-Franzens University, Innrain 52a, 6020 Innsbruck, Austria. E-mail: [email protected]
Introduction
Together with the growing importance of nanotechnology, there comes a demand for a fast, easy to handle and automated analytical method to investigate new nano-materials. There are a number of conventional methods such as scanning electron microscopy (SEM), mercury intrusion porosimetry (MIP), laser diffraction, nitrogen absorption following the Brunauer–Emmett–Teller (BET) theory or size exclusion chromatography (SEC). They all have in common that they measure only one parameter and that they are invasive, time consuming, hard to automate and require experienced personnel. In contrast, near infrared (NIR) spectroscopy offers a fast, easy to handle, powerful, non-destructive, easily automated method where several parameters can be determined simultaneously. The investigated materials comprise nano-porous silica particles, dendrimers, nano-coated capillaries, lipid nano vesicles and carbon nanomaterials such as fullerenes, carbon nanotubes (CNTs) and nanocrystalline diamond (NCD). In addition, special focus is also put on particle size determination of nano-powders.
During recent years, nano materials have grown in importance for science and industry. An investigation using the CAS SciFinder software (American Chemical Society, Washington DC, USA) to find references containing the word “nano” revealed 433 references before 1989, 7108 references between 1990 and 1999 and 117,976 references for the years 2000–2011. The word “nano” has its roots in the Greek word “nannos”, which means dwarf. One nanometre equals 10–9 m and, for comparison, the diameter of a fibre from a spiders web measures approximately 1000 nm. When talking about nanotechnology work carried out with materials, the range from 0.1 nm to 100 nm is usually meant. With matter having sizes in the nanoscale range, special physical, chemical, electrical, medical, mechanical and optical properties can be achieved.1 Together with the increasing importance of nanomaterials comes the need for fast, robust and accurate analytical methods for their physical, chemical and morphological characterisation. As mentioned above, there are a number of well-established methods such as electron microscopy, laser diffraction, optical microscope image analysis or the Coulter Counter method for particle size analysis.2 Specific surface area can be determined with nitrogen absorption based on the BET equation and pore size and pore volume, applying MIP or SEC. The analysis of chemical properties is not only limited to identification but also the observation of derivatisations or surface coverage. A number of methods such as nuclear magnetic resonance spectroscopy or elementary analysis are therefore applied.3,4 Most of these methods are time-consuming, many are invasive, hard to automate, require experienced operators and some of them show poor reproducibility. In contrast, NIR spectroscopy offers a fast, powerful, easy to handle, non-destructive and high-throughput analysis where almost no sample preparation is needed. Having the capability to perform in- and on-line real-time monitoring of processes, NIR spectroscopy has become one of the key methods for the process analytical technology initiative of the US Food and Drug Administration, the aim of which is to monitor and optimise a product throughout the production process and “design” the quality of a product instead of exclusively enacting quality control of a final product in a laboratory.5 NIR spectroscopy is now a well-established technique with the first commercially-available, stand-alone instruments having appeared in the 1980s. In addition to the above mentioned advantages, NIR spectroscopy can, for some quantitative analyses, show higher performance compared to mid-infrared spectroscopy, mainly due to combination vibrations and overtones appearing in the wavenumber range from 4000–10,000 cm–1 and also offers the possibility to determine physical and chemical properties simultaneously.6 A relatively new trend in the field of NIR spectroscopy is hyperspectral imaging where spectra are recorded as a function of the areal distribution. State-of-the-art instruments, in combination with microscopy, can record spectra with a lateral resolution of only a few micrometres.7 Presently, NIR spectroscopy is deployed as an analytical method in agriculture, food sector, petrochemistry, pharmaceutical sector, environmental sector, clinical sector and many other fields.8 This article highlights recent applications of NIR spectroscopy on nanostructured materials.
Particle size determination
It has long been known that the particle size in a powder has a strong influence on the resulting NIR diffuse reflection spectra;9 this is most obviously observed in a shift of the baseline (offset).10 This phenomenon can be best described with the Kubelka–Munk model where reflectance (R∞) is related to the scattering coefficient (S) and the absorption coefficient (K):11
![]()
There are a large number of publications describing particle size determination using NIR spectroscopy. All are based on the Kubelka–Munk theory and Ciurczak’s work on aspirin, ascorbic acid, Al2O3 and (NH4)3PO4 for particles larger than 85 µm,12,13 stating that the larger the particles are, the higher the observed absorption is. Higgins and co-workers were the first to analyse nano-particles with a D90 (D90 is defined as the diameter where 90% of the particles have a smaller equivalent diameter) smaller than 250 nm.14 They observed that the Kubelka–Munk theory was not applicable anymore as smaller particles showed higher absorbance than larger ones. This can be explained because the light path, after interaction with smaller particles, is longer than in powders with larger particles, as the light path increases with the number of re-reflections between the smaller particles. This explanation is illustrated in Figure 1. Bittner et al.15 demonstrated an approach to simultaneously identify and determine the particle size of amoxicillin trihydrate particles in the sub-micrometre range (D90 = 6.9–21.7 µm) observing the same effects as Higgins and proving a linearity between absorbance and reciprocal particle diameter at higher wavenumbers (>7000 cm–1). Khanmohammadi et al.16 investigated the feasibility of NIR spectroscopy to predict the particle size of TiO2 nanoparticles. They successfully developed a model using 35 different sieved samples (five classes, 20 nm to >130 µm) applying back propagation artificial neural networks as a non-linear model.
 large particles and (b) smaller particles. Reproduced with permission from Reference 14.")
Nano-porous silica materials
Silica gels play the single most important role as stationary phases for chromatographic-based separation procedures. To achieve maximum separation efficiencies, it is important to know physical properties such as particle size, pore volume and specific surface area.17 Silica-based stationary phases can be divided into porous-, non-porous particles and monoliths. Porous silica particles tend to be the most universally applicable ones finding use in solid phase extraction (SPE), high-performance liquid chromatography, micro liquid-chromatography, capillary electrophoresis (CE), capillary electro-chromatography, gas chromatography and material enhanced laser desorption ionisation time-of-flight /mass spectrometry (MELDI-ToF/MS).18 Najam-ul-Haq and co-workers19 applied NIR spectroscopy, in combination with multivariate data analysis, to characterise porous silica particles. Cluster models based on the particle size and the pore size were established. Petter et al.17 reported on quantitative partial least square regression-based models to determine particle size in the range 3–14 µm, pore diameters in the range 7–400 nm and specific surface in the range 10–458 m² g–1 of porous silica particles. A principal component analysis (PCA) cluster model allowed for the classification of pure silica, amino-silica and silica-C18. This information derives from the corresponding stretching and deformation vibrations of C–H, N–H and O–H bonds in the NIR region.
Carbon nanomaterials
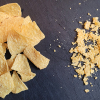
Carbon nanomaterials comprise fullerenes, NCD, CNTs and graphitic-nano-fibres. They show several advantages and unique properties compared to other materials. The presence of 80–99.5% sp2-hybridised carbon facilitates further derivatisation steps and the increased surface area ratio enables improved sensitivity for stationary phases, for example for SPE1 or CE.20 Glassy carbon electrodes modified with carbon nanomaterials can increase the performance of electrochemical applications significantly, showing higher sensitivities, lower limits of detection and faster electron transfer kinetics.21,22 Figure 2 shows a range of carbon nanomaterials as well as silica particles and dendrimers that have been investigated with NIR spectroscopy.

Carbon nanotubes (CNTs)
CNTs have unique features, being able to display metallic, semiconducting as well as superconducting electron transport. CNTs possess a hollow core, allowing guest molecules to be stored and show the largest elastic modulus of any known material.21 Generally, CNTs can be divided into two groups: single wall carbon nanotubes (SWCNT) having a cylindrical nanostructure, which is formed by a single, rolled-up graphite sheet, showing high aspect ratio, and multi-walled carbon nanotubes (MWCNT), which are assemblies of several layers of graphene cylinders with varying diameter encircling one another with an interlayer space of 0.34 nm. While SWCNTs typically show diameters of 0.4–3 nm, MWCNTs have diameters of 1.4–100 nm.23 NIR spectroscopy has been well established as a powerful tool for the characterisation of the electronic band structure of CNTs. One of the first reports of NIR spectroscopy as a tool for the investigation of CNTs was published by Chen et al.,24 followed up by others such as Itkis et al.25,26 and Liu et al.27
C60 fullerenes
Since the discovery of the buckminsterfullerene (C60) in 1985 research on it has subsequently grown. Various fullerenes with diameters in the range of 20–100 nm are of high interest in the field of peptide and protein identification for diagnostic marker research.28 To shorten the turnaround time in the lab, NIR spectroscopy, in combination with multivariate data analysis, was introduced to monitor and verify derivatisation steps. A robust PCA model to identify C60, C60-aminosilica, C60-epoxysilica, dioctadeclymethano-[60]-fullerene and IDA-[60]-fullerene was established.17
Nanocrystalline diamond (NCD)
NCD can be deposited forming a thin layer on several substrates such as nickel, graphite and titanium to selectively bind several molecules from biological fluids. Using the MELDI screening approach, NCD showed the highest sensitivity of all carbon nanomaterials with a lower limit of detection of 600 attomol. Due to the combined characteristics of chemisorption and physisorption NCD offers excellent regeneration capabilities.29 The surface can be either –O or –H terminated showing hydrophilic or hydrophobic properties, respectively. For a successful further derivatisation it is crucial to have information about the termination type. X-ray photoelectron spectroscopy can be carried out to distinguish between –H and –O termination. This requires trained personnel and enormous expenditure on instrumentation. Heigl et al.1 developed a NIR spectroscopic method to determine the termination mode with high precision applying a fibre-optic probe under nitrogen atmosphere.
Nano-coated capillaries
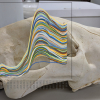
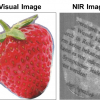
Inner wall coatings of fused silica capillaries for CE help to prevent irreversible protein absorption during the electrophoretic separation process.20 Near infrared hyperspectral imaging can be used as a tool for quality control of the derivatisation of the capillaries. We developed a PCA-based cluster model to identify uncoated fused silica, latexdiol- coated- and fullerenol-coated fused silica capillaries. Having an inner diameter of <75 µm and a coating thickness of only 100 nm, a special experimental set-up was created whereby the end of the capillary was sanded down using sandpaper P1000 at a 45° angle prior to being measured in NIR reflection mode with a lateral resolution of 6.25 µm (Figure 3).

Guest–host interactions among dendrimers
Dendrimers feature a well-defined globular shape, having a branched structure consisting of an interior core of shells (generations) and terminal functional groups. Size molecular weight and chemical functionality are easily controllable. There is a wide variety of applications in the fields of chemistry, physics, pharmaceuticals and clinical chemistry. Heigl et al.30 used NIR spectroscopy to guest–host interactions between G0–G7 amine-terminated poly(amidoamine) as “guests” and porous silica materials as “hosts” to predict molecular weights ranging from 0.52 kDa to 116.49 kDa and particle diameters ranging from 1.5 nm to 8.1 nm. Porous silica particles have a constant pore size, with dendrimers showing smaller particle size than the pore size, having access to the interior of the silica particles, while larger particles can only interact with the silica surface.
Lipid nano vesicles
Lipid nano vesicles are applied in drug delivery and as membrane substances due to their unique osmotic activity, membrane permeability, chemical composition and surface characteristics. Such liposomes are spherical, self-closed nanostructures consisting of lipid bilayers that enclose parts of the surrounding solvent into their interior. Bista et al.31 applied NIR spectroscopy to investigate synthetic polyethyleneglycolated lipids that spontaneously form liposomes upon hydration. NIR absorption spectroscopy is deployed for the band component analysis of the samples in liquid form to get a broader understanding of the molecular structure and conformation.
Conclusion
The suitability of NIR spectroscopy as a tool to replace numerous conventional methods for the investigation of nanostructured materials such as nano-porous silica particles, dendrimers, nano-coated capillaries, lipid nano vesicles and carbon nanomaterials was illustrated and summarised. Due to all the advantages listed below, this method has high potential to become well-established and widely used in the field of nanotechnology, particularly with regard to PAT applications:
- non-invasive
- simultaneous determination of physical and chemical properties
- short analysis time
- high throughput analysis
- easy measurement
- no/almost no sample preparation necessary.
References
- N. Heigl, C.H. Petter, M. Najam-Ul-Haq, M. Rainer, R.M. Vallant, G.K. Bonn and C.W. Huck, “When size matters—near infrared reflection spectroscopy of nanostructured materials“, J. Near Infrared Spectrosc. 16, 211 (2008).
- S.C. Gad, Pharmaceutical Manufacturing Handbook. John Wiley & Sons Inc., Hoboken, New Jersey, USA (2008).
- F. Liu, G. Xu, J. Wu, Y. Cheng, J. Guo and P. Cui, “Synthesis and electrorheological properties of oxalate group-modified amorphous titanium oxide nanoparticles”, Colloid Polym. Sci. 18, 1739 (2010).
- M.V. Gomez, J. Guerra, A.H. Velders and R.M. Crooks, “NMR characterization of fourth-generation PAMAM dendrimers in the presence and absence of palladium dendrimer-encapsulated nanoparticles”, J. Am. Chem. Soc. 131, 341 (2008).
- H. Leuenberger and M. Lanz, “Pharmaceutical powder technology—from art to science: the challenge of the FDA’s Process Analytical Technology initiative”, Adv. Powder Technol. 16, 3 (2005).
- C.W. Huck and L. Bittner, “Infrared spectroscopy: A novel tool for the physicochemical characterization of particulate, monolithic and coated stationary phases”, Chromatographia published on-line (2011).
- C. Pezzei, J.D. Pallua, G. Schaefer, C. Seifarth, V. Huck-Pezzei, L.K. Bittner, H. Klocker, G. Bartsch, G.K. Bonn and C.W. Huck, “Characterization of normal and malignant prostate tissue by Fourier transform infrared microspectroscopy“, Mol. BioSyst. 6, 2287 (2010).
- M. Blanco and I. Villarroya, “NIR spectroscopy: a rapid-response analytical tool”, Trends Anal. Chem. 21, 240 (2002).
- H.C. van de Hulst, Light Scattering by Small Particles. Dover Publications, Mineola, Texas, USA (1981).
- E.W. Ciurczak and J.K. Drennen, Pharmaceutical and Medical Applications of Near-Infrared Spectroscopy. CRC Press, Boca Raton, Florida, USA (2002).
- P. Kubelka and F. Munk, “Ein beltrag zur optik der farbanstriche“, Z. Tech. Physik 12, 593 (1931).
- E. Ciurczak, “Use of near infrared in pharmaceutical analyses“, Appl. Spectrosc. Rev. 23, 2 (1987).
- E.W. Ciurczak, R.P. Torlini and M.P. Demkowicz, “Determination of particle size of pharmaceutical raw materials using near-infrared reflectance spectroscopy“, Spectroscopy 1, 36 (1986).
- J.P. Higgins, S.M. Arrivo, G. Thurau, R.L. Green, W. Bowen, A. Lange, A.C. Templeton, D.L. Thomas and R.A. Reed, “Spectroscopic approach for on-line monitoring of particle size during the processing of pharmaceutical nanoparticles“, Anal. Chem. 75, 1777 (2003).
- L.K.H. Bittner, N. Heigl, C.H. Petter, M.F. Noisternig, U.J. Griesser, G.K. Bonn and C.W. Huck, “Near-infrared reflection spectroscopy (NIRS) as a successful tool for simultaneous identification and particle size determination of amoxicillin trihydrate”, J. Pharm. Biomed. Anal. 54, 1059 (2010).
- M. Khanmohammadi, A.B. Garmarudi, N. Khoddami, K. Shabani and M. Khanlari, “A novel technique based on diffuse reflectance near-infrared spectrometry and back-propagation artificial neural network for estimation of particle size in TiO2 nano particle samples”, Microchem. J. 95, 337 (2010).
- C.H. Petter, N. Heigl, G.K. Bonn and C.W. Huck, “Fast, non-invasive and simultaneous near-infrared spectroscopic characterisation of physicochemical stationary phases’ properties: from silica particles towards monoliths“, J. Sep. Sci. 31, 2541 (2008).
- C.W. Huck, N. Heigl, M. Najam-ul-Haq, M. Rainer, R.M. Vallant and G.K. Bonn, “Progress in silica chemistry—determination of physico–chemical parameters via near-infrared diffuse reflection spectroscopy“, Open Anal. Chem. J. 1, 21 (2007).
- M. Najam-ul-Haq, M. Rainer, N. Heigl, Z. Szabo, R. Vallant, C.W. Huck, H. Engelhardt, K.D. Bischoff and G.K. Bonn, “Nano-structured support materials, their characterisation and serum protein profiling through MALDI/TOF-MS“, Amino Acids 34, 279 (2008).
- S. Bachmann, R. Vallant, R. Bakry, C.W. Huck, D. Corradini and G.K. Bonn, “CE coupled to MALDI with novel covalently coated capillaries“, Electrophoresis 31, 618 (2010).
- J. Wang, “Carbon-nanotube based electrochemical biosensors: A review“, Electroanalysis 17, 7 (2005).
- C.B. Jacobs, M.J. Peairs and B.J. Venton, “Review: Carbon nanotube based electrochemical sensors for biomolecules“, Anal. Chim. Acta 662, 105 (2010).
- K. Gong, Y. Yan, M. Zhang, L. Su, S. Xiong and L. Mao, “Electrochemistry and electroanalytical applications of carbon nanotubes: a review“, Anal. Sci. 21, 1383 (2005).
- J. Chen, M.A. Hamon, H. Hu, Y. Chen, A.M. Rao, P.C. Eklund and R.C. Haddon, “Solution properties of single-walled carbon nanotubes”, Science 282, 95 (1998).
- M.E. Itkis, D.E. Perea, S. Niyogi, S.M. Rickard, M.A. Hamon, H. Hu, B. Zhao and R.C. Haddon, “Purity evaluation of as-prepared single-walled carbon nanotube soot by use of solution-phase near-IR spectroscopy”, Nano Lett. 3, 309 (2003).
- M.E. Itkis, D.E. Perea, S. Niyogi, J. Love, J. Tang, A. Yu, C. Kang, R. Jung and R.C. Haddon, “Optimization of the Ni−Y catalyst composition in bulk electric arc synthesis of single-walled carbon nanotubes by use of near-infrared spectroscopy”, J. Phys. Chem. B 108, 12770 (2004).
- X. Liu, T. Pichler, M. Knupfer, M. Golden, J. Fink, H. Kataura and Y. Achiba, “Detailed analysis of the mean diameter and diameter distribution of single-wall carbon nanotubes from their optical response“, Phys. Rev. B 66, 045411 (2002).
- R.M. Vallant, Z. Szabo, L. Trojer, M. Najam-ul-Haq, M. Rainer, C.W. Huck, R. Bakry and G.K. Bonn, “A new analytical material-enhanced laser desorption ionization (MELDI) based approach for the determination of low-mass serum constituents using fullerene derivatives for selective enrichment“, J. Proteome Res. 6, 44 (2007).
- M. Najam-ul-Haq, M. Rainer, C.W. Huck, P. Hausberger, H. Kraushaar and G.K. Bonn, “Nanostructured diamond-like carbon on digital versatile disc as a matrix-free target for laser desorption-ionization mass spectrometry”, Anal. Chem. 80, 7467 (2008).
- N. Heigl, S. Bachmann, C.H. Petter, M. Marchetti-Deschmann, G. Allmaier, G.K. Bonn and C.W. Huck, “Near-infrared spectroscopic study on guest–host interactions among G0–G7 amine-terminated poly(amidoamine) dendrimers and porous silica materials for simultaneously determining the molecular weight and particle diameter by multivariate calibration techniques”, Anal. Chem. 81, 5655 (2009).
- R.K. Bista and R.F. Bruch, “Near-infrared spectroscopy of newly developed PEGylated lipids”, Spectrochim. Acta, Part A 71, 410 (2008).