Christopher Shaffer and Didier Bonvin
Thermo Fisher Scientific SARL, 1024 Ecublens, Switzerland. E-mail: [email protected]
Introduction
Although X-ray fluorescence (XRF) is a well-established technique, new areas of applications and performance improvements are being continuously developed. Due to recent advances in X-ray instrumentation and technique, there is a wider choice of solutions available to industries and research laboratories alike depending on the analytical requirements. Recently launched XRF spectrometers integrate the usual elemental analysis capabilities alongside mapping and small spot analyses. This creates an innovative solution for advanced materials characterisation together with unmatched versatility and performance for the analysis of solids and liquids. With small spot analysis and elemental mapping, a new way of elemental evaluation can be used for improved process control, failure analysis and root cause investigations.
Wavelength dispersive X-ray fluorescence (WDXRF) is well established for determination of chemical element concentrations in all sorts of materials. Most of the elements of the Mendeleev Periodic Table can be analysed in a wide variety of samples with accuracy, precision and reliability. This analysis technique is used in many industries, contract laboratories, academies and universities for fast determination of elemental composition. Geological materials, ores, metals, ceramics, refractory, glasses, polymers, and even oils and other liquids, are notable applications. The X-ray fluorescence versatility in handling both conducting and non-conducting solids, its accuracy and excellent precision for the majority of the elements and its wide dynamic range (from part per million to 100%) are good reasons why it is selected as the technique of choice in many cases. One advantage of X-ray fluorescence is that it is a non-destructive technique, which means that after analysis the samples can be kept for future reference or for complementary analysis using other techniques. Sometimes the samples can be analysed as received without any sample preparation, but for better accuracy in the determination of elemental content a simple preparation is generally required. For metals the typical preparation will consist of grinding the specimen with abrasive paper to get a flat and clean surface. Rocks, ores and minerals are milled to get a fine grain size and pressed to present a flat surface to the XRF spectrometer.
In many industries raw materials, intermediate and final products can suffer from inhomogeneous distribution of elements. Certain elements can be considered “toxic” in particular processes. They can affect batching, process control, quality and reproducibility during production. Usually for WDXRF analysis, inhomogeneous samples must be homogenised as much as possible before analysing them for determination of their chemical concentrations. Grinding, blending and either pressing or fusing the sample is required for the most accurate compositional analysis.1 However, potentially vital information about the raw materials and processing can be lost in these processes.
Elemental mapping
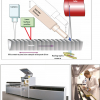
Advanced XRF spectrometers can be configured with a camera and internal mechanism that allows the spectrometer to pick the X-ray fluorescence signal from a specific spot on the sample surface. The spot size can be as small as 0.5 mm in diameter. Measurement of several spots side by side with steps of 0.1 mm or more permits mapping or cartography of the element distribution on the sample surface.
The depth of analysis depends on the X-ray fluorescence energy of the element considered and the absorption by the matrix elements. It ranges from fractions of micrometres for the lightest elements like boron or carbon in an iron matrix to several millimetres for heavier elements in light matrices.1
Little sample preparation is needed for elemental mapping by XRF. The sample must typically be smaller than 52 mm in diameter in order to fit into a sample holder. For the most accurate results, the analysis surface should ideally be completely flat but curved or uneven samples can also be measured. All the analyses reported here were undertaken using a Thermo Scientific ARL PERFORM’X XRF spectrometer.
Application examples
Applications in metals
Within the metals industry, a final product is usually considered to be a homogenous distribution of elements throughout the entire batch. This unfortunately is not always the case. For example, elemental segregation can occur during the cooling process, oxide inclusion can agglomerate together and foreign material can contaminate the finished product.2
Normally in XRF, samples containing these features are seen as potential problems and must be homogenised as much as possible. One method to help overcome this is re-melting the sample in order to eliminate or reduce these issues. This procedure can homogenise the overall composition of the product; however, vital information regarding the separation, contamination and inclusion are clearly completely lost.
With small spot analysis and elemental mapping, a new way of elemental evaluation can be used to determine and identify segregation for improved process control, failure analysis and root cause investigations. As an example a nickel alloy sample was cut using a metal saw and the sample surface was polished with 120 grit sandpaper.
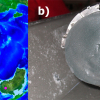
Looking for inclusion agglomeration the sample was mapped for sulfur over a rectangular portion defined by the on-board camera of the Thermo Scientific ARL Perform’X (see Figure 1).
 Picture of a nickel alloy sample showing inclusions (b) elemental mapping of sulfur.")
Sulfur inclusions in this material can create strength and hardness issues in the final product. The elemental mapping results in Figure 1 clearly show spikes of sulfur in the metallic sample. These results aid in the detection of defect products or in a root cause analysis investigation of product failure.
Segregation in precious alloys
In principle better control of the raw material sources should lead to better control of the production process. But this is not always true. Even when the product is of the highest quality, issues still can arise in other areas of production. These can be caused by improper batching, over or under heating in kilns, debris contamination or plating issues are examples of just a few possibilities.
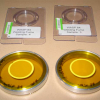
Elemental mapping can be used to investigate such issues. As an example, analysis was performed on a set of four gold plated standard samples. These samples were intended for XRF precious metal calibrations. The calibrations obtained from this set were not producing good linear regressions. Visual inspection could not detect any problem with the samples (see Figure 2—bottom right). Hence they were mapped to determine the elemental distribution of Au, Ag, Zn and Cu over the coin surface. One of the samples clearly exhibited an homogeneity problem as seen in Figure 2. The four elements mapped were Au, Ag, Cu and Zn. The two-dimensional results show a distinct band of high concentrations for both Cu and Zn and conversely a low concentration of Au at this location (see Figure 2—top right). This segregation is not visible to the naked eye.

An overlay of these element distributions confirms the heterogeneity issue and helps identify the root cause for the poor calibrations.
Composition of a rock
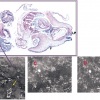
Raw materials can often come in the form of mined rocks which provide good examples of the usefulness of elemental mapping.3 These types of materials are normally anything but homogeneous. For an investigation on the elemental distribution in a rock sample, elemental mapping was performed for Na, Al, P, K, Ca, Ti, Fe, Rb and Si over the red square area displayed on Figure 3. The results of this elemental mapping are broken down into three different representations, shown, respectively, in Figures 3, 4 and 5.
 with the mapped area highlighted by the red square.")

The preliminary results shown in Figure 4 as two-dimensional representations illustrate element concentration indication with colour brightness. The brighter colour characterises a higher acquired intensity concentration of each element on the mapped scan. This view allows for a quick visual orientation of one element compared to another and helps determine which elements are combined together. Obviously in this example Al, Rb, Fe, K and Ti are combined into a compound, P, Ca and Na into another, and silica represents another phase.
One can combine all the results into one elemental overlay image that shows the relationship of the element distribution by designating different colours for each element (as illustrated in Figure 3). This kind of image should enable an expert geologist to determine the mineral types present in the rock sample.4

Finally, for a better illustration a three-dimensional image set can also be used with the largest relative concentrations represented with the highest peaks. This method allows for an easy comparison of single element concentration over the entire mapped surface, as shown, for example, for the iron distribution in Figure 5.
Conclusion
Elemental mapping is meant to bridge the gap between traditional bulk WDXRF analysis and standard micro-analysis using microscopic techniques such as scanning electron microscopy (SEM). WDXRF analysis usually enables the average concentration of each constituent element to be determined in the sample over the viewed area (typically 35 mm or 29 mm in diameter, but smaller areas down to 5 mm in diameter are also feasible). For small spot analysis or mapping a spot size typically of 0.5 mm is used. Movement from spot to spot can be as low as 0.1 mm for optimal resolution. The elemental mapping easily allows one to recognise the type of alloy of a millimetre-sized inclusion or the composition of an inhomogeneity within a sample.
The most common and routine use of WDXRF has always been for analysis of elemental concentration in homogeneous samples in order to help process and quality control in many industries and applications. However, with new innovations such as mapping and small spot analysis, WDXRF is becoming an increasingly valuable research and failure analysis technique expanding its potential towards new applications where problems of segregation, gradients or inclusions must be controlled.
References
- Retsch GmbH, The Sample, International Edition Number 5, http://www.retsch.com/downloads/customer-magazine-the-sample/dl_details/1/file/1469/
- C. Shaffer, D. Bonvin and A. Kohler, Small Spot and Elemental Mapping Analysis in Metals using X-Ray Fluorescence. Millenium Steel (2012).
- W.D. Ness, Introduction to Mineralogy.Oxford University Press (2000). ISBN: 0-19-510691-1
- M. D. Dyar, M.E. Gunter and D. Tasa, Mineralogy and Optical Mineralogy. Mineralogical Society of America (2007). ISBN: 978-0-939950-81-2