Antonella Rossi,a,b Bernhard Elsenera and Nicholas D. SpencerbaDepartment of Inorganic and Analytical Chemistry, University of Cagliari, Campus of Monserrato, 09100 Cagliari, Italy
bLaboratory for Surface Science and Technology, Department of Materials, ETH-Hönggerberg, Wolfgang-Pauli-Strasse 10, CH-8093 Zürich, Switzerland.E-mail: [email protected], [email protected]; http://dipcia.unica.it/superf/ and http://www.surface.mat.ethz.ch
Introduction
There is increasing interest in applying surface-analytical techniques to the characterisation of materials that have been surface functionalised by methods such as self-assembled monolayers, chemical adsorption reactions, electroless deposition, plasma treatment and many others. Surface analysis provides important information on the surface composition of a material, which may be different from the nominal bulk composition, the chemical state of the elements on the surface (related to toxicity), contaminants in thin films (semiconductor industry), the nature of chemical interactions with both clean and oxidised surfaces (adhesion, corrosion inhibitors) and changes in the surface properties (wetting), both following controlled modification and as a consequence of ageing. Among the plethora of available surface-analytical techniques, special emphasis has been placed, in our laboratories, on X-ray photoelectron spectroscopy (XPS or ESCA).
XPS surface analysis
XPS spectroscopy has its roots in nuclear physics research (Rutherford 1914), although it first attracted major interest in 1964 when it was first demonstrated that chemical-state information could be obtained by measuring the kinetic energy of electrons emitted by a sample irradiated with soft X-ray beams. Since then, enormous progress has been made, both by instrument manufacturers and researchers, to improve the quality of spectrometers, standards of operation and procedures for quantification. XPS is in many cases a non-destructive technique, can be applied to insulating samples and combines high sensitivity with chemical-state identification. XPS is well suited to the quantitative investigation of surface films of thicknesses in the nanometre range. The latest instruments with parallel data acquisition allow the realisation of XPS surface chemical state microscopy with a lateral resolution of ca 9 µm (on non-magnetisable materials even to less than 3 µm). By means of angular-resolved data acquisition, in-depth composition profiles can be obtained without sputtering and a recent spectrometer has been produced with a lens–detector combination that allows parallel acquisition of angle-resolved data without the need for tilting the sample.
The principle
X-ray photoelectron spectroscopy (XPS) is based on the photoelectric effect: photons of an adequate energy hn from an X-ray beam ionise atoms in the sample resulting in the emission of core-level electrons. Photo-ionisation comprises: (1) photon absorption, (2) electron emission, (3) displacement of the electron within the solid and (4) escape of the electron from the solid into the vacuum of the spectrometer. The atomic processes of photoelectron emission are schematically illustrated in the diagram of the energy levels of Figure 1.
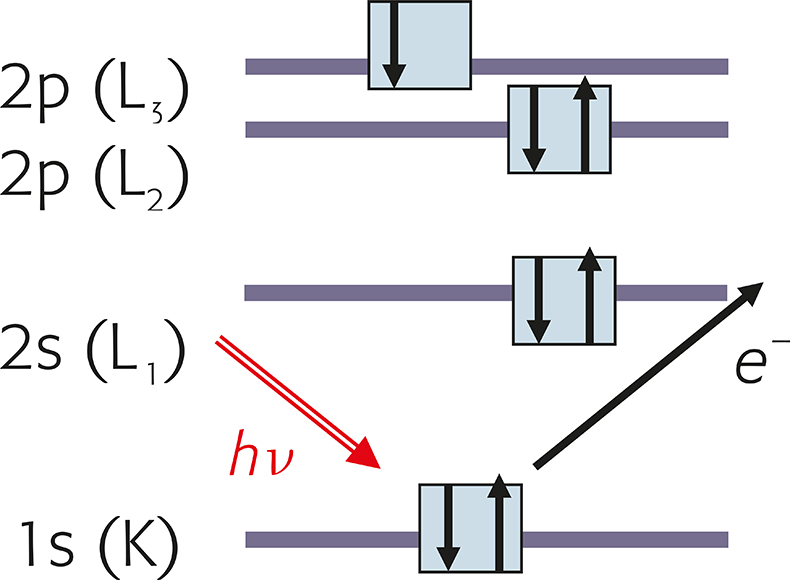
Figure 1. Schematic of the photoemission process. The X-radiation, hn ejects a photoelectron from the K orbital (XPS notation 1s).
According to the principle of conservation of energy, the sum of the energy of the initial state, Ei plus the photon energy, hn, is equal to the sum of the energy of the final Ef state plus the kinetic energy of the emitted photoelectron, KE. Rearranging, one obtains the binding energy, BE, of the photoelectron from Equation (1) (the difference in energy of the final and the initial state) as the difference between the energy of the incident beam minus the kinetic energy of the emitted photoelectron.
BE = hn – KE = Ef – Ei (1)
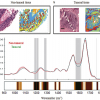
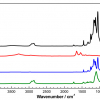
As each element has characteristic core-electron binding energies, it will therefore emit photoelectrons with a characteristic kinetic energy for a given photon energy. Element identification can thus be accomplished by recording the photoelectron energy distribution (spectrum), which will show intensity peaks corresponding to different elements. As an example, the survey spectrum of a steel surface before and after ion etching is shown in Figure 2. The spectrum recorded before ion-etching (a) exhibits photoelectron signals attributable to photoemission from core levels of iron (Fe2p), oxygen (01s) and carbon (C1s), to photoemission from valence levels (Fe3s, Fe3p), and peaks due to X-ray-excited Auger emission (FeLMM). Filling the core vacancy with an electron originating from an outer level generates these Auger peaks. After ion etching only the signals of iron are detected. It should be noted that the photoelectron peaks are narrower and simpler than the Auger signals. The background increases on the low-kinetic-energy side (high-BE side) of the peaks due to the occurrence of inelastic photoemission. The acronym ESCA (electron spectroscopy for chemical analysis) underlines the fact that both photoelectron and Auger electron peaks appear in the “XPS” spectrum.
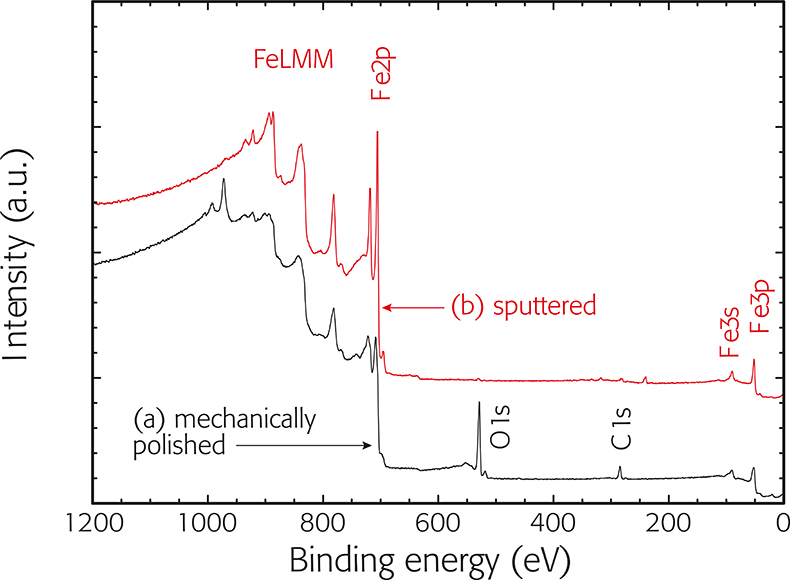
Figure 2. Survey spectra of a steel surface after (a) mechanical polishing and (b) following sputtering in UHV. Core levels: iron Fe2p, oxygen 01s, carbon C1s. Valence levels: Fe3p, Fe3s. X-ray excited Auger electrons: FeLMM. The spectrum of the sputtered steel is shifted vertically for better visibility.
Chemical state information
In 1958, Siegbahn’s group in Uppsala (Sweden) showed that copper (I) oxide could be distinguished from copper (II) oxide by XPS. The difference in binding energy between the same atom, either in two chemically different sites in the same compound or in two different compounds, is referred to as the “chemical shift”. The chemical shift results from a change in the electrostatic screening of the core electrons when the valence electrons are attracted or repulsed in the emitting atom. Many factors can contribute to the chemical shift and usually its interpretation is accomplished on empirical basis. A description of chemical shift theory is given in the literature.1
From the analytical point of view, it is very useful to compare the measured binding energy for the unknown element with the binding energy, measured under the same experimental conditions, of a reference compound. Tables of peak positions may be found in the literature and a database produced by Wagner may be obtained on disc from NIST.2 However, it is not always possible to identify the chemical state of an element based on binding energy alone. Other features of the XPS spectra have to be examined, such as the presence of shake-up satellites or the combination with the chemical shift obtained from the X-ray-excited Auger lines in a two-dimensional Wagner plot.
Instrumentation
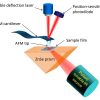
A basic block diagram of an X-ray photoelectron spectrometer is given in Figure 3. It consists of an ultra-high vacuum chamber equipped with an X-ray source, usually MgKa (1253.6 eV) and/or AlKa (1486.6 eV), which can be monochromatic, a lens system that collects the photo-ejected electrons, an energy analyser, a detector and a suitable system for displaying signal intensity as a function of the kinetic or binding energy. The electron-energy analyser is the heart of the system; its task is to measure the electron energy spectrum.
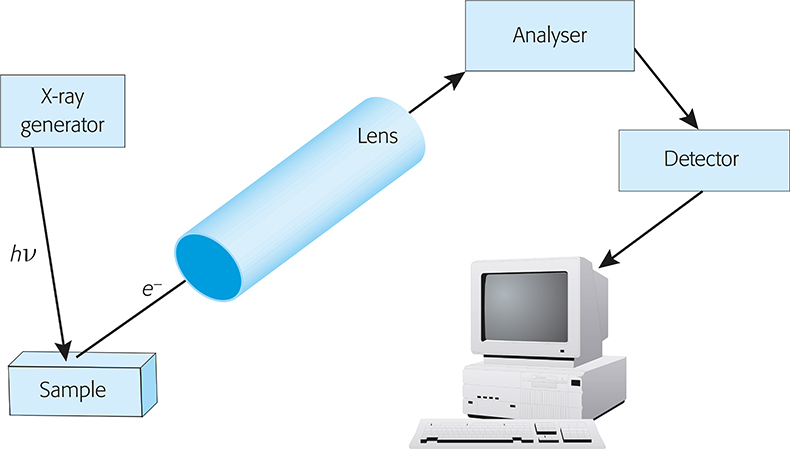
Figure 3. Block diagram of a basic XPS instrument
Most older spectrometers have poor lateral resolution; however, with recent generation imaging photoelectron spectrometers, lateral resolution down to about 3 µm can be achieved. XPS imaging offers new opportunities compared to existing surface-analysis techniques. The combination of parallel acquisition of all spatial information, combined with good signal/background ratios allow chemical-state imaging to be performed with low sample damage, even in the case of insulators. These possibilities, however, are accompanied by an increased complexity of the physical background of the lens and detector system that makes quantification more difficult.
Applications
Surface of stainless steels: passivity
Stainless steels are the most important group of materials used in aggressive environments (chemical industry, transportation, building industry). These iron-based materials are alloyed with chromium (18–25%), nickel (8–20%) and molybdenum (0–6%). The spontaneous formation of a very thin protective oxide layer (2–5 nm thick) is the key factor in the protection of these materials (passivity). Surface-analytical studies of austenitic stainless steels of different compositions in the literature concentrate on passive films formed in acidic solutions, where generally a marked enrichment of chromium ions in the passive films and an increase of the film thickness with potential are reported. A more systematic study on the effect of solution pH and potential on film thickness and composition were undertaken by the surface analysis group at the University of Cagliari. High purity Fe–Cr and Fe–Cr–Ni alloys and commercial austenitic and ferritic steels were studied.
Film thickness and composition were calculated with a three-layer model (Figure 4), originally proposed by Hashimoto and modified at the University of Cagliari. The surface of the sample consists of an outermost contamination layer, an oxy-hydroxide layer and the metallic substrate (semi-infinite). It is assumed that both thickness and composition of each layer are homogeneous. It follows (Figure 4) that electrons emitted from the alloy are attenuated exponentially by the oxy-hydroxide and the contamination layer; the contamination layer also attenuates photoelectrons from the oxide layer. Using the measured integrated intensities (peak areas in Figure 4) obtained after non-linear background subtraction and curve fitting as input data for the model, the thickness of the oxy-hydroxide film and the contamination layer and the composition of the oxy-hydroxide film and the alloy beneath can be calculated from a single XPS analysis.
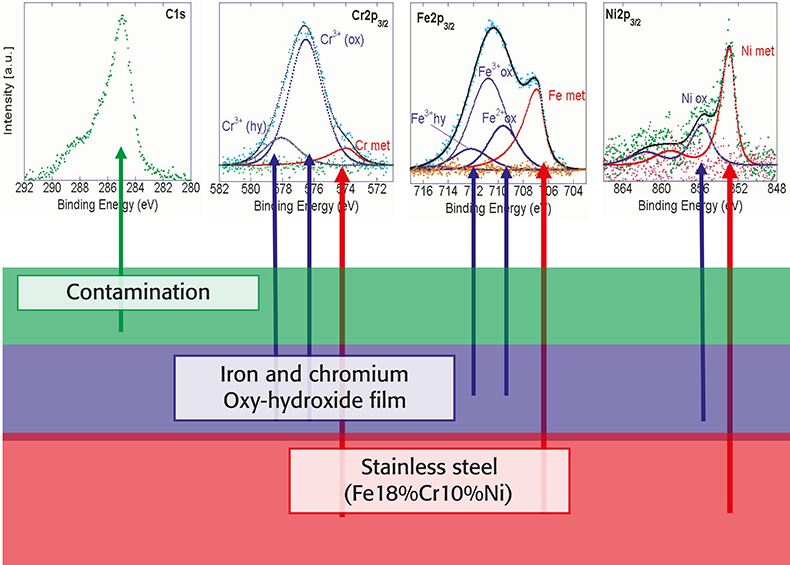
Figure 4. Three-layer model for the determination of thickness and composition of the oxy-hydroxide film on multicomponent alloys. Top: high-resolution spectra of C1s, Cr2p, Fe2p and Ni2p after background subtraction and curve fitting.
The basic equations of the model give, for each element i, the intensity Ii after attenuation by the oxide layer (thickness t) and the contamination layer (thickness lc):
Ii = [(gi × si × Ci × ri × Li)/Ai] ×
exp(–lc /Licon) × exp(–t/Liox) (2)
In the calculations, the concentration of the element Ci, the atomic weight Ai, the density of the oxy-hydroxide layer rox and of the substrate rsub and instrumental factors g (proportional to Ekin–0.5) need to be entered. Scofield’s photoionisation cross-section values, s, corrected for the angular asymmetry function L(g) with g = 49.1° for the instrument, were used as sensitivity factors. The mean free-path values L(Ekin) of the electrons were calculated using the semi-empirical formula proposed by Seah and Dench; full details are given in Reference 3.
The total thickness of the passive film [Figure 5(a)] calculated according to the three-layer model with a constant density for the passive film of r = 5 g cm–3 increases with the passivation potential and with pH. The effect of the polarisation potential is marked at high pH values. The passive film thickness on the high-alloyed stainless steel (25% Cr, 20% Ni and 6% Mo) has been found to be thinner than that on the common 18/8 CrNi steel. The average Cr3+ concentration of the passive film depends strongly on the passivation potential and on the pH [Figure 5(b)]: the Cr3+ content is higher at low pH values and at low potentials. Experiments in alkaline solutions are in progress.
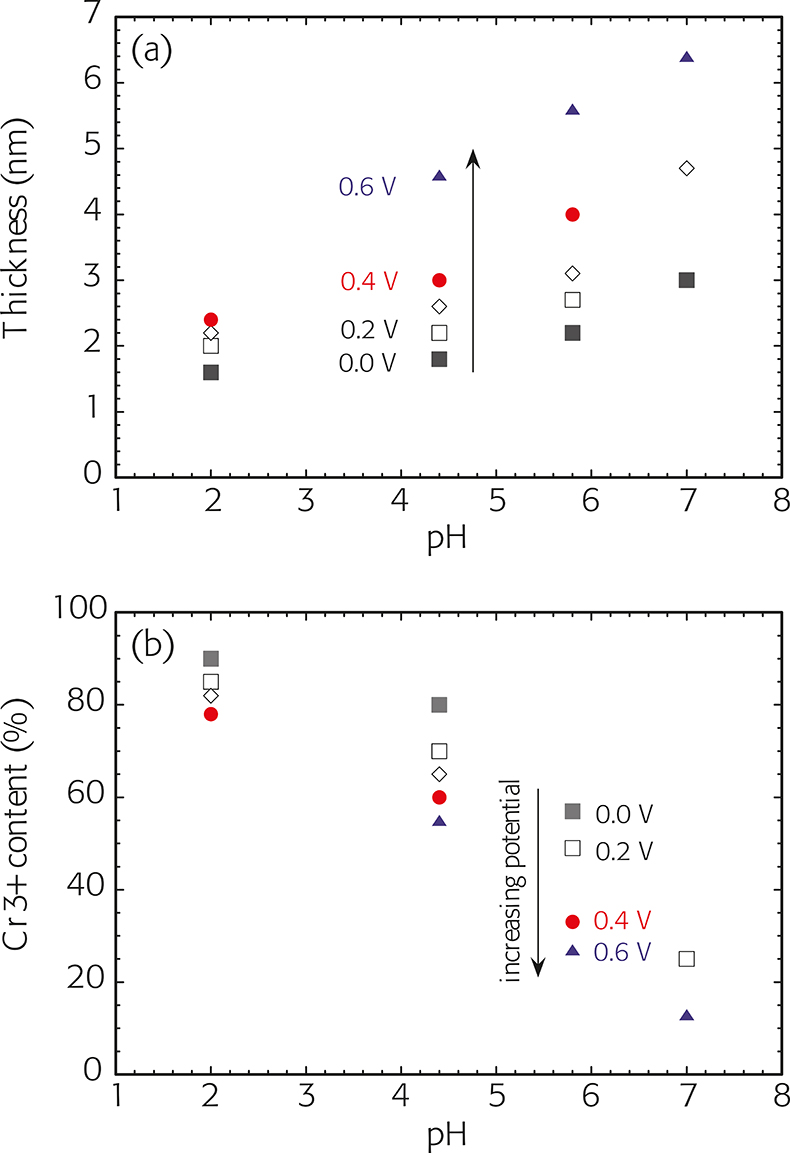
Figure 5. (a) thickness and (b) Cr3+ content of the oxy-hydroxide films formed on 1.4301 stainless steel (18% Cr, 8% Ni) at different potentials as a function of solution pH. Polarisation time 1 h; potential in V vs SCE.
Angle-resolved XPS
The three-layer model assumes homogeneous films without in-depth concentration gradients. However, XPS measurements at an angle of 45° reveal that both the hydroxide (OH–) and the Cr3+(hy) components are located in the outer part of the film. Angle-resolved X-ray photoelectron spectroscopy (ARXPS) allows us to study the depth distribution of the different components in thin layers, see Figure 6. From the trend of the intensity with angle the location of the compound can be determined: a continuous increase (as for metallic iron) indicates that this species is in the inner part. The trend of the intensities of the oxygen signals O(MeO) and O(MeOH) suggests that beneath the carbon layer there is an oxy-hydroxide layer. Such ARXPS data – especially when collected with parallel acquisition (without tilting the sample) – can be used to reconstruct the in-depth concentration profile. Unfortunately there is no method for the direct transformation from a set of ARXPS data to a concentration depth profile (mathematically an “ill posed problem”). The most promising approach is the Maximum Entropy Method (MEM), which calculates the most probable depth profile. The noise in the data is a crucial point in the depth profile reconstruction.1
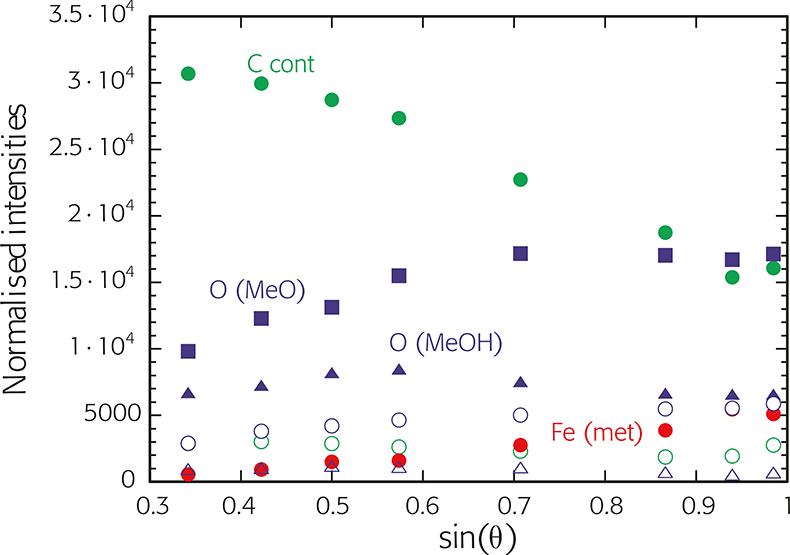
Figure 6. Angle-resolved XPS (ARXPS) of iron after mechanical polishing with ethanol in air. The normalised intensities of all the detected species are plotted versus sin(q). q = 90° is perpendicular to sample surface. Normalisation was performed with the sensitivity factors C 0.802, O 2.43 and Fe 9.24.
Imaging XPS in tribochemistry
Imaging techniques, such as imaging X-ray photoelectron spectroscopy (i-XPS), scanning Auger microscopy and ToF-SIMS (time-of-flight secondary ion mass spectrometry), allow heterogeneous sample surfaces to be studied and spatial distributions and relationships between chemical species to be obtained. The lateral resolution is on the order of a few micrometres in the case of i-XPS and several hundreds of nanometres with ToF-SIMS, going down to nanometres in the case of Auger microscopy. Much of the literature describing the use of i-XPS is based on the observation of simple peak or peak-minus-background images, which are used as a guide for subsequent small-area spectroscopy analysis. Our research interest, however, is to develop analytical methods that allow full quantification of images taking into account an appropriate background description and overlapping photoelectron peaks from different chemical states (“chemical state mapping”).
Imaging XPS has been used to investigate the surface of 100Cr6 steel after tribological tests (pin on disk) performed in the presence of lubricant oil with 1% of ZnDTP (zinc dialkyldithiophosphate) as an anti-wear additive with the goal of identifying the reaction mechanism on a molecular level of ZnDTP with the steel surface. Such information is vital, if a new, environmentally friendly substitute for this effective additive is to be found. At the Laboratory for Surface Science and Technology of the Swiss Federal Institute in Zurich this is an ongoing research topic.
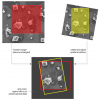
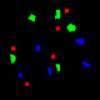
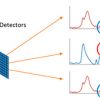
XPS spectra were acquired for the regions of interest using scanning XPS with a 120 µm probe raster over 2 mm area; thus a set of full XPS spectra is collected at each pixel of the image. As an example, the map of the 01s signal of a tribostressed sample is shown in Figure 7(a). From the 01s map (sum of all the different components (01s total) two regions were selected (scar and non-contact region) and the 01s spectra of these regions were extracted [Figure 7(b)]. Using the PHI Multipak (Physical Electronics, Inc.) software at each pixel a linear least square fit of the 01s spectrum was performed. The resulting chemical-state maps [Figure 7(c)] revealed the spatial location of oxide (530.3 eV), hydroxide and phosphate (531.8 eV) species. It is apparent that in the worn area a higher concentration of phosphate (and/or hydroxides) is present, whereas in the non-contact region the (original) oxide film is present. Similar results are obtained by processing the images obtained for the other elements present on the surface (iron, phosphorus) of the tribostressed sample. The results show that the ZnDTP molecule in the tribostressed contact zone reacts forming an iron phosphate film that might explain the excellent anti-wear properties of the additive. Dependence on the applied load was studied applying a combinatorial approach. Thickness and composition of the film formed under different mechanical conditions were evaluated.4,5
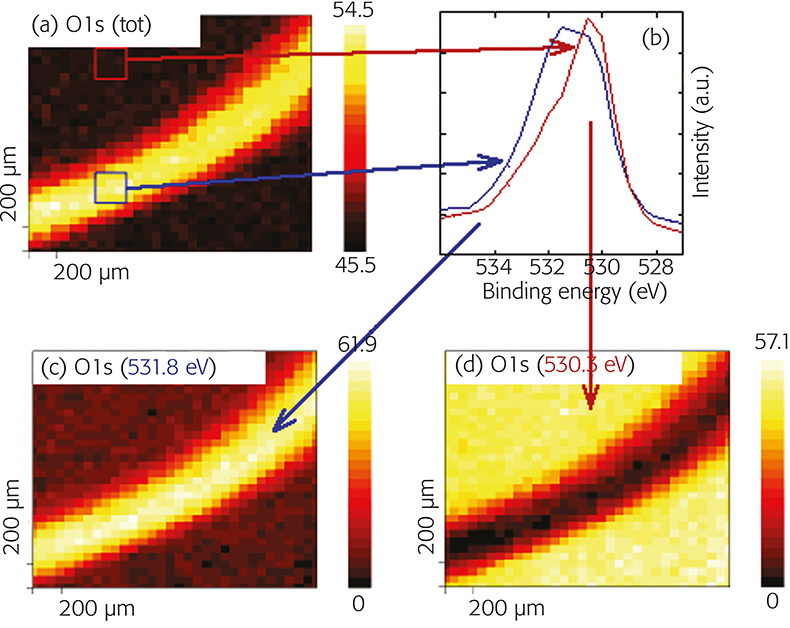
Figure 7. (a) 01s map, (b) extracted spectra and (c) chemical-state maps of tribostressed 100Cr6 (52100) steel. Ball-on-disk geometry, load 10 N after Stribeck curve, ambient temperature, polyalpha olefin oil with 1% ZnDTP antiwear additive.
Monitoring polymer surfaces modifications
In the large clinical disposable device sector, polymeric materials have always played an important role, combining ease of processing, flexibility and favourable price/performance ratio. Plasticised poly(vinyl chloride) (PVC) is the most widely utilised material for the production of blood and blood-component contacting devices, including blood-storage bags, catheters and tubing for extracorporeal circuits. Nowadays, for the final sterilisation process ionising radiation methods are mainly employed. These suffer from several drawbacks, such as thermal effects and chemical modification to the irradiated substrate.
The influence of the b-ray sterilisation procedure on the surface properties of plasticised PVC devices of a bloodline was studied by XPS surface analysis. First, XPS analysis conditions were established where the exposure to the X-rays did not result in surface damage, limiting the total acquisition time to less then eight minutes. Extruded parts of plasticised PVC were then studied in the non-sterilised state and after both 25 and 50 kGy dosage of b-rays in order to investigate the effect of the sterilisation treatment on the surface-chemical composition. XPS survey spectra presented no signals other then carbon, chlorine, oxygen and calcium. The detailed analysis of the regions showed that the carbon C1s, Cl2p and 01s signal were multi-component, containing signals of the PVC, the plasticiser and the other additives. The binding energies remained constant, irrespective of the b-ray sterilisation dosage, but the amount of the chlorine component at 198.3 ± 0.1 eV (associated with modified PVC) decreased with sterilisation dosage (Figure 8). ARXPS revealed that this component is located at the outermost surface of the polymer. It can be hypothesised that even during the production processes (extrusion and/or injection molded) a modification of the polymer surface and surface segregation of the plasticiser may take place. The subsequent sterilisation treatment (heating the polymer) allows dehydrochlorination to remain but, owing to the very short time needed by the b-ray technology, it does not allow atmospheric oxygen to diffuse into the irradiated material, thus inhibiting further side-degradations, such as thermo-oxidative degradation.6
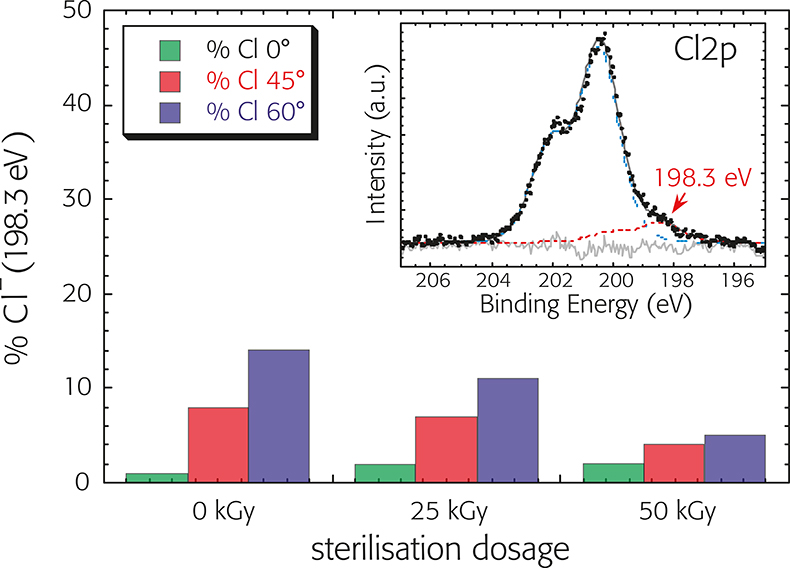
Figure 8. Percentage of the chlorine component at 198.3 ± 0.1 eV (associated with modified PVC) measured at three different take-off angles (0°, 45° and 60°) as a function of sterilisation dosage. Insert: C12p spectra after background subtraction and curve fitting.
Conclusions
X-ray photoelectron spectroscopy (XPS) has become a very well-established analytical tool for the investigation and characterisation of materials surfaces – an important activity, given that very often functional properties are determined by the outermost layers of the material. XPS provides elemental and chemical-state information and with the help of mathematical algorithms allows the determination of both composition and thickness of thin surface films, as well as the composition of the interface beneath. To enhance the surface sensitivity of XPS it is possible to vary the angle between the surface normal and the direction of the photoelectrons (angle-resolved XPS). XPS can usually be obtained with a lateral resolution between several hundred micrometres and 3 µm, with the latest generation of imaging XP spectrometers. These microscopy spectrometers allow the distribution of different chemical states of a given element to be mapped, even on insulating samples.
References
- D. Briggs and J.T. Grant, Surface Analysis by Auger and X-ray Photoelectron Spectroscopy. Surface Spectra and IM Publications, Manchester and Chichester, UK (2003).
- NIST Surface Structure Database, www.nist.gov/srd/webguide/nist42-4/42-4.htm
- Rossi and B. Elsener, Materials Science Forum 185–188, 337–346 (1995) and references therein.
- M. Eglin, A. Rossi and N.D. Spencer, “Additive-Surface Interaction in Boundary Lubrication: A Combinatorial Approach”, in Trib. Ser. 40, “Boundary and Mixed Lubrication: Science and Application”, Ed by D. Dowson, M. Priest, G. Dalmaz and A.A. Lubrecht. Elsevier, pp. 49–57 (2002).
- M. Eglin, A. Rossi and N.D. Spencer, Tribology Lett. 15(3), 199–209 (2003).https://doi.org/10.1023/A:1024805001625
- D. Atzei, B. Elsener, M. Manfredini, A. Marchetti, M. Malagoli, F. Galavotti and A. Rossi, Surf. Interface Anal. 35, 673 (2003).https://doi.org/10.1002/sia.1590