Michael A. Bernstein
AstraZeneca R&D Charnwood, Bakewell Road, Loughborough, Leics. LE11 5RH, UK. E-mail: [email protected]
Process Analytical Technology (PAT) is a US Food and Drug Administration (FDA) initiative to improve drug substance manufacturing. Control over production processes and impurity production are key elements. These lead to more robust and cheaper production processes, facilitate predictable scale-up and technology transfer and more effectively manage the risk.
Our focus here is analytical procedures, and the role of nuclear magnetic resonance (NMR) in particular. These have, until now, largely relied on conventional chromatography, and vibrational spectroscopy—infrared (IR), Raman and near infrared (NIR) spectroscopy.1 In spite of inherent difficulties with peak assignment and reliable quantification, vibrational spectroscopy has been used to derive information on reaction progression to impart fundamental understanding. This article sets out a wider scope to show how NMR can play a key role. Furthermore, NMR integrates well with established procedures to provide a suite of useful technologies that makes the PAT challenge tractable.2
1H and 13C NMR hold a unique place in organic synthesis due to the large amount of structural information encoded in the data. 1H NMR spectroscopy may be considered as a “molar detector” in which the signal area is closely tied to the solute concentration and number of contributing protons in the molecule. All proton-bearing species in the solution will produce peaks in the NMR spectrum. Newer technologies such as cold probes and preamplifiers have significantly lowered the detection limits, and spectra can now be recorded in a few minutes where perhaps 100 µg of material is present. Deuterated solvent use is not a requirement. NMR has been used classically to monitor reaction progress because it affords accurate concentrations of all major species, and this data can be used to derive precise kinetic and thermodynamic data. NMR can be used to directly determine the structure of reaction intermediates and impurities. However, the strengths of NMR can be weaknesses to analysts requiring less chemospecific indicators, for example, of reaction progression, and this has led to a widespread adoption of IR and NIR for in-line monitoring.
At AstraZeneca Charnwood we have adopted a working paradigm for PAT that attempts to encompass all useful spectroscopic methods. Generally, early stages in method development need information-rich technologies that build detailed reaction understanding, and as one progresses to large-scale production the emphasis shifts to easily applied analytical methods that can afford data in real time in the reactor. Information derived from one method can often be passed to a second to ensure that it is used correctly. For example, having a well-established product build-up curve derived from NMR studies, the corresponding IR peak that affords the same profile can then be confidently used for the same analysis.
Reaction optimisation and route planning demand good chemical analysis and reaction understanding. Here NMR can play a key role because it can be used to derive considerable reaction detail: kinetics and thermodynamic parameters, solute concentrations, and species identification. The detailed structural information derived from NMR experiments may be used directly to optimise reaction yield and by-product formation under given reaction conditions. It is preferable to collect NMR information at regular time intervals through the course of the reaction, because this complete picture of species concentrations is a rich source of information and understanding (see below). Our experience has shown this technology to be as valuable in optimising productive chemistry as it is in confidently determining unproductive synthetic routes. Lastly, these results can further be used in a factorial experimental design (FED) experiment to optimise reaction conditions and to perhaps choose a more environmentally friendly solvent.
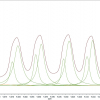
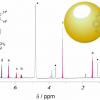
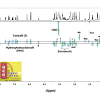
In Figure 1 we show 13C NMR data collected for a reaction that was carried out in a conventional NMR tube: a spectrum was collected every 15 min over the time course of the reaction. The lower trace was acquired when the reagents were first mixed, and a starting material (SM) peak at c. 142.8 ppm is evident. The top spectrum was recorded after the reaction was complete: the reactant peak height was reduced almost to zero, indicating that starting material consumption was essentially complete. A new peak ascribed to product was evident at 141.3 ppm. In addition, a number of low-intensity peaks could just be seen in the region of 146 ppm, and one could speculate that these arise from side-products. But these spectra in isolation impart limited information: we routinely acquire multiple (c. 64) spectra over the course of the reaction at evenly spaced time points. This is shown in the centre as a pseudo-2D plot, where peak heights are depicted by the coloured contours. The blue background represents the noise floor, and warmer colours reflect increased peak areas. The product peak concentration can be seen to slowly build through the reaction time course and the SM peak area concomitantly decreases, but we can see without extensive analysis that the reaction is not a simple case of: A + B → C + impurities. Significant changes in chemical shift reflect transient protonation and deprotonation of a neighbouring reactant molecule nitrogen that is not involved directly in the chemical transformation, and some impurity peaks start to appear with this proton transfer event. The chemical processes that occur through the course of the experiment are more complex than evident at first glance and are reported in the NMR spectra recorded whilst the reaction was allowed to occur in an NMR tube in the NMR spectrometer.
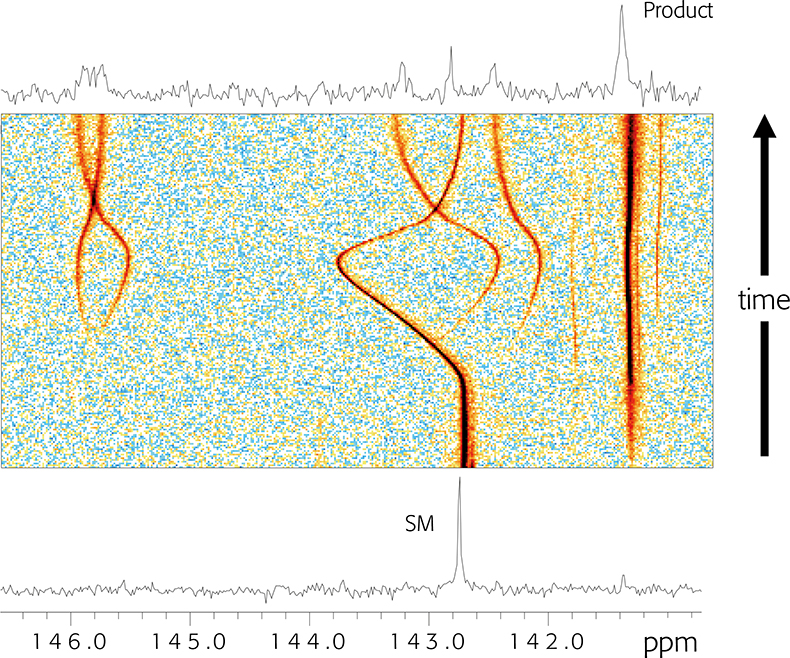
Figure 1. 13C NMR spectra recorded through the course of a chemical reaction. See text for details.
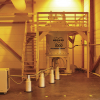
NMR used to follow reaction kinetics in NMR tubes is quite common, but this requires a homogeneous, single-phase liquid or broad solute signals will be observed: this precludes a swath of useful chemistry. To address this shortcoming we have built an apparatus based on a conventional jacketed glass chemical reactor. The liquid reactant is sampled, pumped through an NMR flow cell and returned to the reactor. NMR spectra are recorded in the usual way whilst a homogeneous sample of the reactant is in the flow cell. The design of this apparatus requires consideration of chemically inertness, minimisation of backpressure and steps taken to ensure that the reaction temperature is maintained and monitored through the entire apparatus. A flow schematic and picture of the apparatus is shown in Figure 2. The reactor and pump are housed in a fume cabinet: jacketed and temperature regulated transfer tubing transport the reactant solution to and from the spectrometer magnet and flow probe (not shown). High performance liquid chromatography (HPLC) tubing terminated in a 2 µm filter is introduced to the reactor vessel, and liquid reaction mixture is sampled and submitted to NMR analysis.
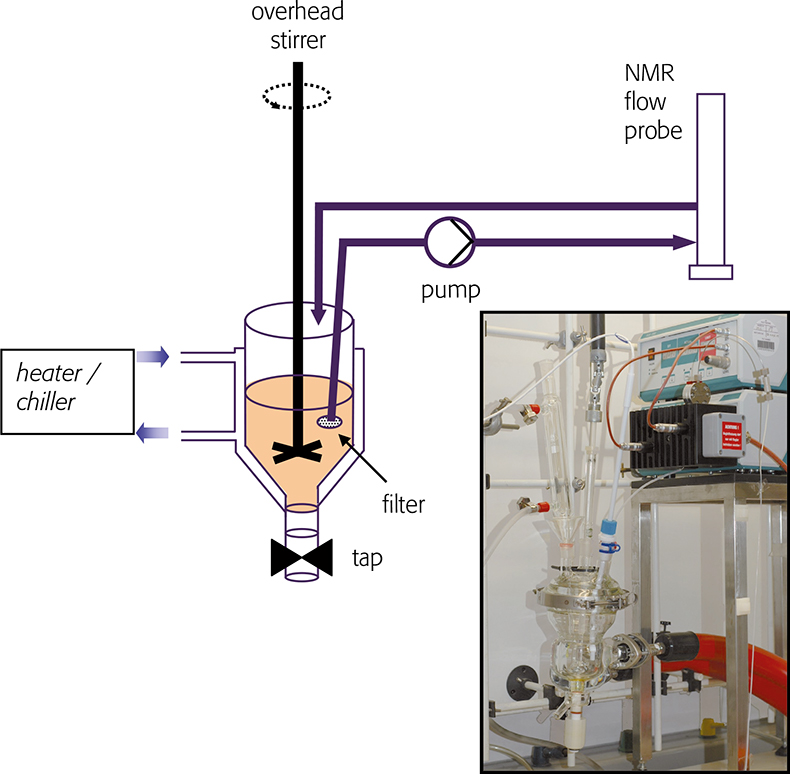
Figure 2. Sketch of an apparatus for sampling chemical reactions and recording NMR spectra. Inset: photograph of glass reactor and pump.
Conclusions and future directions
We use chromatography, vibrational spectroscopy and now NMR to assist Process Chemistry in meeting the challenges of PAT. The key to effective implementation is using the right tool at the right time, and to correlate information from one technique to the next. NMR is used for structure determination and following the course of reactions and is well suited to early studies of route optimisation and development. But it is not well suited for in-line monitoring in the plant—vibrational spectroscopy is very well suited to this.
Reaction monitoring using NMR detection has proven fruitful at early stages of pathway development. The derived information is rich in chemical detail that can be used to better understand reaction mechanisms and thereby control experiments. In the simplest cases the experiment can be conveniently set up and monitored in a conventional NMR tube. A more general solution is a conventional glass chemical reactor fitted with a sampling device where a pump circulates the reaction mixture through an NMR flow cell. This new information and synergy provides a rich toolset for the process chemist and chemical engineer, and addresses the analytical challenges of PAT.
References
- E. Skibsted, “Near infrared spectroscopy: the workhorse in the PAT toolbox”, Spectroscopy Europe 18(5), 14–17 (2006). https://www.spectroscopyeurope.com/article/near-infrared-spectroscopy-workhorse-pat-toolbox
- M.A. Bernstein, M. Štefinović and C.J. Sleigh, “Optimising reaction performance in the pharmaceutical industry by monitoring with NMR”, Magn. Reson. Chem. 45(7), 564–571 (2007) https://doi.org/10.1002/mrc.2007 and references cited therein.