Karsten Hinrichs, Christoph Kratz and Andreas Furchner
Leibniz-Institut für Analytische Wissenschaften – ISAS – e.V., Department Berlin, Schwarzschildstr. 8, 12489 Berlin, Germany
Contacts
[email protected] ( 0000-0002-6580-7791)
[email protected] ( 0000-0002-5448-7956)
Introduction
Fast, contact-less and destruction-free hyperspectral infrared (IR) techniques that enable large-area mapping within short measurement times are highly relevant for research and industry in environmental, biomedical, material and space applications. Laser-based methods provide high optical throughput as well as high spectral, spatial and temporal resolution, and are thus of particular interest for analytical, process, laboratory and field applications.
In this article, we focus on a recently introduced, rapid, laser-based hyperspectral method for thin-film analysis in the mid-IR fingerprint range. Featuring a polarimetric single-shot design, both phase and amplitude information related to refractive and absorption indices are simultaneously recorded. A tuneable, pulsed quantum cascade laser (QCL) enables spectrally highly resolved (<0.5 cm–1) ellipsometric mapping at lateral resolutions of ≤120 µm. High QCL tuning speeds provide access to time-dependent measurements of single spots in the µs/ms range, and fast hyperspectral mapping of large sample areas (50 × 50 mm2). The single-shot approach ensures robustness with respect to pulse-to-pulse intensity variations and changes in environmental conditions like humidity. Hyperspectral and time-dependent phase and amplitude images facilitate the chemical identification of a specific material via its vibrational fingerprint, but also interpretation with respect to film thickness, molecular structure, composition and homogeneity of these parameters.
Laser-based IR imaging
Mid-infrared (MIR) imaging beyond classical Fourier-transform infrared (FT-IR) techniques recently showed promising developments for material science,1–8 medical diagnostics and the study of biological samples.9–11 IR spectroscopic applications are significantly broadened and strengthened by modern technical advances such as upconversion-based hyperspectral imaging,4,9 hyperspectral nanospectroscopy,1–3,5–7,10 frequency-comb techniques,12 visible-diffraction limited optical photothermal IR multi-spectral imaging,11 and QCL-based single-shot polarisation dependent hyperspectral concepts.7,8,13
IR imaging as a linear optical technique can reveal vibrational and structural sample information. Being contact-less, label-free and non-destructive, IR imaging can also be performed under varying environmental conditions. The latest advances in detection systems, optical set-ups and the use of brilliant MIR light sourcesopen the door for new IR spectroscopic possibilities with respect to lateral and time resolution, structure analyses, as well as imaging capabilities in general. Particularly the involvement of QCL sources allows one to overcome the limits of classical FT-IR spectroscopy both in far-field and near-field IR-related techniques. Typical applications are time-resolved13 and hyperspectral IR ellipsometry8 (Sentech Instruments), photothermal AFM-IR2 (e.g., from Bruker/Anasys), visible-diffraction limited spectroscopy11 [e.g., optical photothermal infrared (O-PTIR) spectroscopy from Photothermal Spectroscopy Corp.], and scattering near-field IR spectroscopy1,5 (e.g., from Neaspec and Bruker).
In this article, we focus on MIR laser-based polarimetric imaging (i.e., hyperspectral ellipsometry) as a new method to simultaneously reveal vibrational, structural and thickness information.8,13
Method of hyperspectral single-shot ellipsometry
The developed hyperspectral IR laser polarimeter incorporates a four-channel division-of-amplitude concept14 that enables simultaneous single-shot amplitude and phase measurements at the laser repetition rate. Time-dependent measurements of individual spots (pixels) are possible with sub-decisecond resolution spectrally and sub-millisecond resolution down to 10 µs at a single wavelength. Fast hyperspectral amplitude and phase imaging is achieved by lateral sample mapping. Compared to classical IR ellipsometric imaging using FT-IR, measurement times are considerably reduced with this new laser-based ellipsometric technique.
The polarimeter (Sentech Instruments) consists of a tilt- and height-adjustable sample mapping stage (50 mm × 50 mm) and an autocollimation unit for defined sample alignment. A pulsed external-cavity QCL (MIRcat 2100, Daylight Solutions) is employed as a brilliant, broadband-tuneable radiation source. A custom-built beamsplitter optics divides and directs the laser beam into four parallel detection channels, each equipped with a polarising unit (KRS-5 wire-grid polariser, Specac) and a photovoltaic InAsSb detector (P13894-211, Hamamatsu). A custom-built gated-integrator electronics synchronises the polarisation-state analysers of the four channels, thus enabling single-shot ellipsometric measurements.
By selecting specific polariser settings and additional optical elements like retarders, it is possible to tailor the four detection channels. This flexible approach allows one to measure various polarimetric parameters, for example, ellipsometric amplitudes (tan Ψ), phases (Δ) or specific Mueller–Matrix elements related to the sample’s polarimetric properties (e.g., circular/linear dichroism and birefringence).15,7
In this contribution, we focus on single-shot measurements of the ellipsometric angles Ψ and Δ. Using a different polariser setting α in each of the four detection channels, the single-shot ellipsometer measures Ψ and Δ from the intensities Iα according to:
\[\cos 2\Psi = {{{I_{90^\circ }} - {I_{0^\circ }}} \over {{I_{90^\circ }} + {I_{0^\circ }}}},\;\;\;\;\;\sin 2\Psi \,\,\cos \Delta = {{{I_{45^\circ }} - {I_{135^\circ }}} \over {{I_{45^\circ }} + {I_{135^\circ }}}}\] (1)
Further technical details regarding the device and measurement protocol can be found in References 8 and 13.
The ellipsometric angles Ψ and Δ are functions of the incidence angle ψ0, the wavelength λ, the optical constants of substrate (NS), ambient medium (N0) and layers (Nj), as well as of the individual layer thicknesses dj,
\[\tan \Psi \cdot {{\rm{e}}^{i\Delta }} = {{{r_p}} \over {{r_s}}} = F\left( {{\varphi _0},\lambda ,{N_S},{N_0},{N_j},{d_j}} \right)\] (2)
j = 0, 1, 2,… number of layers, with rp and rs being the p- and s-polarised complex reflection coefficients. The optical constants N = n + ik (N: complex refractive index; n: refractive index; k: absorption index) are related to the complex dielectric function ε = ε1 + iε2 via N = √ε.
Measuring both Ψ and Δ yields complementary information regarding the sample’s optical and structural properties, thus providing a means to in-depth sample analysis. Various routes are possible for evaluating the structure-related baselines and material-specific vibrational bands of hyperspectral IR ellipsometric data, including direct spectral interpretation, optical modelling and multivariate analysis.
Hyperspectral IR ellipsometry
Single-shot hyperspectral IR polarimetric imaging of a sample provides ellipsometric parameters dependent on wavelength and up to three spacetime coordinates. Regarding data interpretation, characteristic vibrational bands such as carboxyl, CHx and amide bands16 of lipids, proteins and polymers yield detailed insights into the film’s properties.13 Such data, therefore, enable unprecedentedly comprehensive, laterally resolved analysis with respect to molecular structure, chemistry, interactions, optical anisotropy, composition, morphology, film thickness and variations thereof.
In the following, we present two examples: one on the simultaneous phase and amplitude mapping of a heterogeneous surface and one on a time-dependent investigation of individual sample spots under external temperature stimuli.
Hyperspectral imaging of heterogeneous thin films
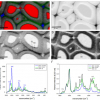
The first sample is a drop-cast thin film of myristic acid (MyA) [CH3(CH2)12COOH] on a gold substrate.13 The homogeneous, 150 nm thick film was partially chemically modified using droplets of NaOH dissolved in ethanol, resulting in areas of pure MyA, intermediate regions and areas of complexed-like MyA. Hyperspectral measurements of the film are presented in Figure 1, showing exemplary images and spectra obtained from the multidimensional data cube.
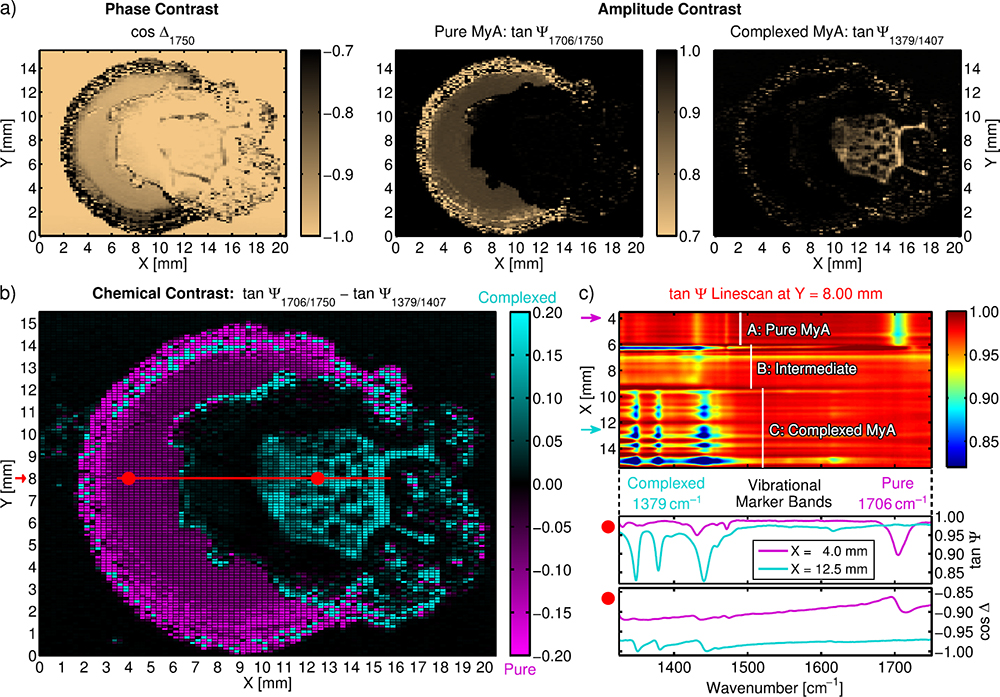
Figure 1. Hyperspectral IR ellipsometry images of a partially chemically modified, drop-cast MyA film. a) Phase and amplitude contrast at different wavelengths. b) Chemical contrast between pure and complexed MyA. c) tan Ψ linescan across the heterogeneous sample surface and exemplary ellipsometric spectra. Reprinted with permission from Reference 8 (©2019, Optical Society of America).
Figure 1a shows complementary phase and amplitude contrast images at different IR wavelengths. These images readily identify areas with varying thicknesses (mainly in cos Δ) and/or a chemical structure (mainly in tan Ψ). The chemical contrast image in Figure 1b shows the difference in band amplitudes of two vibrational markers at 1706 cm–1 (associated with C=O carboxyl vibrations of pure MyA) and at 1379 cm–1 (associated with complexed MyA), thus enabling the direct visual domain separation of pure and complexed MyA.
A spectral tan Ψ linescan along the red line in Figure 1b is presented in Figure 1c, highlighting the distinct vibrational characteristics of the different sample areas. Comparing the variations in spectral intensities reveals that regions of pure MyA are rather homogeneous, whereas those with complexed MyA exhibit pronounced heterogeneity in surface coverage. Pure and complexed domains are separated by an area with low coverage.
A detailed vibrational analysis of, for example, the ν(C=O) band can elucidate molecular interactions and orientations in such complex heterogeneous samples. Beyond such a spectral interpretation, a polarimetric approach can (as stated in Reference 15) “provide a number of contrast mechanisms besides traditional unpolarized radiation intensity, including linear depolarization, circular depolarization, cross-polarization, directional birefringence and dichroism.” The high contrast resulting from the ellipsometric measurement could have tremendous application potential for the imaging and characterisation of complex surfaces (e.g., tissue classification for cancer identification, quality and morphology control of materials). In this regard, hyperspectral data analysis based upon neural networks, multivariate analysis and/or optical modelling could be a promising tool for gaining a detailed understanding of the structural and chemical specificities of the sample.
Together with the high stability concerning disturbing environmental absorptions,7 the capabilities of the IR laser ellipsometer make accessible multiple new IR spectroscopic imaging applications regarding the analysis of structured, anisotropic films and biological samples. Interesting systems to be investigated with the device range from functionalised surfaces and coatings, to polymer and protein materials, minerals, as well as solar cells, OLEDs and other optoelectronic devices and sensors.
Time-resolved studies of thin-film phase transitions
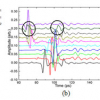
Spectra of single spots can be monitored within about 100 ms, and single wavelengths even as rapidly as 10 µs. The IR laser polarimeter, therefore, pushes new possibilities for time-resolved measurements of non-cyclic processes via flexible measurement durations from the µs to hour range. This point is illustrated in Figure 2, which displays the temperature-resolved investigation of the thermal phase transition of a 150 nm thick MyA film around 55 °C.13 The amplitude and phase images in Figure 2b show the ν(C=O) band progression (cf. spectra in Figure 1c). Characteristic band components due to differently interacting C=O groups can be identified. A strongly interacting component (mode 1) is found in the solid phase at 50 °C, and a weakly interacting one (mode 2) occurs at higher wavenumbers mainly in the liquid phase at 60 °C.
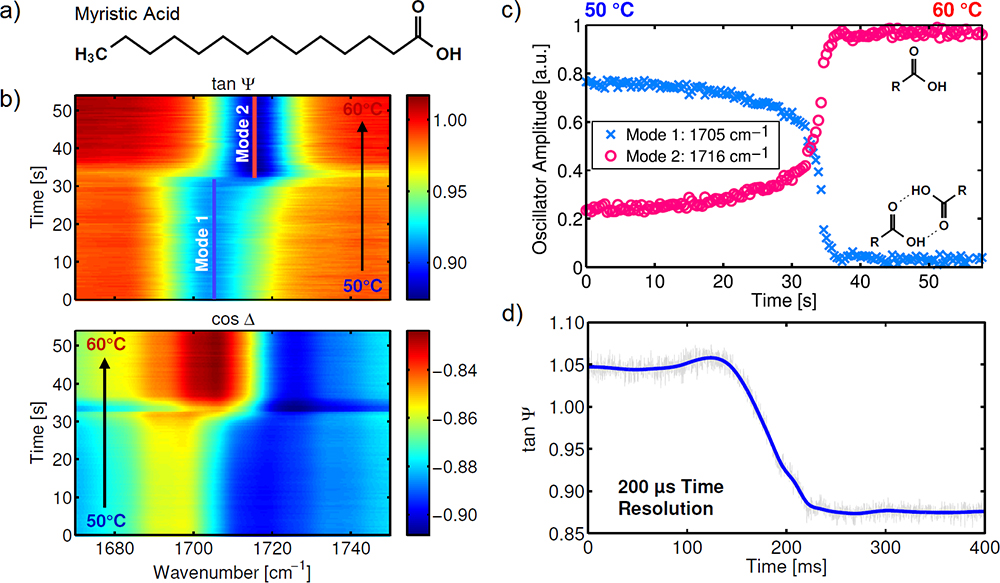
Figure 2. Time-resolved IR laser ellipsometry of the solid-to-liquid phase transition of a fatty-acid thin film upon heating/cooling. a) Chemical structure of MyA. b) ν(C=O) band amplitude and phase during slow heating. c) Oscillator amplitudes of mode 1 and 2 fitted from the spectral images. Reprinted with permission from Reference 13 (©2019, Optical Society of America). d) Sub-ms single-wavelength monitoring of mode 1 during rapid cooling.
Figure 2c shows the time-dependent development of the two ν(C=O) band components obtained from Figure 2b during slow heating. Figure 2d displays the corresponding single-wavelength monitoring of mode 1 during rapid cooling with a time resolution of 200 µs. While both mode 1 and 2 are present below the phase transition, only mode 2 is found above it. These observed changes reveal a tight interrelationship between molecular interactions and thermo-induced phase transition.
As these presented measurements demonstrate, the new IR polarimeter covers multiple time scales ranging from µs to minutes. The results highlight the applicability and sensitivity of the technique for time-dependent analyses of non-cyclic, irreversible processes and reactions. We see powerful applications in process and quality control, but also in rheology, relaxation and related studies. Because of the ellipsometer’s small spot size (0.03 mm2), low sample volumes and amounts can also be studied.
Currently, we are working on coupling microfluidic flow cells17 to the instrument in order to image and analyse processes of functional, sensor and biocompatible surfaces at solid–liquid interfaces. The set-up will then allow for sensing of molecular adsorptions, structural transitions and the study of intra- and intermolecular interactions of nL to mL samples.
A laser application laboratory will be opened at ISAS Berlin (anticipated for the end of 2020) operating and making available a hyperspectral IR laser ellipsometer.
Funding
Europäischer Fonds für regionale Entwicklung (EFRE) (1.8/13); Ministerium für Innovation, Wissenschaft und Forschung des Landes Nordrhein-Westfalen; Regierender Bürgermeister von Berlin – Senatskanzlei Wissenschaft und Forschung; Bundesministerium für Bildung und Forschung.
References
- J.M. Atkin, S. Berweger, A.C. Jones and M.B. Raschke, “Nano-optical imaging and spectroscopy of order, phases, and domains in complex solids”, Adv. Phys. 61, 745–842 (2012). https://doi.org/10.1080/00018732.2012.737982
- A. Dazzi and C.B. Prater, “AFM-IR: technology and applications in nanoscale infrared spectroscopy and chemical imaging”, Chem. Rev. 117, 5146–5173 (2017). https://doi.org/10.1021/acs.chemrev.6b00448
- A. Huber, D. Kazantsev, F. Keilmann, J. Wittborn and R. Hillenbrand, “Simultaneous IR material recognition and conductivity mapping by nanoscale near-field microscopy”, Adv. Mater. 19, 2209–2212 (2007). https://doi.org/10.1002/adma.200602303
- S. Junaid, J. Tomko, M.P. Semtsiv, J. Kischkat, W.T. Masselink, C. Pedersen and P. Tidemand-Lichtenberg, “Mid-infrared upconversion based hyperspectral imaging”, Opt. Exp. 26, 2203–2211 (2018). https://doi.org/10.1364/OE.26.002203
- I. Amenabar, S. Poly, M. Goikoetxea, W. Nuansing, P. Lasch and R. Hillenbrand, “Mid-infrared upconversion based hyperspectral imaging”, Nat. Commun. 8, 14402 (2017). https://doi.org/10.1038/ncomms14402
- K. Hinrichs and T. Shaykhutdinov, “Polarization-dependent atomic force microscopy–infrared spectroscopy (AFM-IR): infrared nanopolarimetric analysis of structure and anisotropy of thin films and surfaces”, Appl. Spectrosc. 72, 817–832 (2018). https://doi.org/10.1177/0003702818763604
- K. Hinrichs, T. Shaykhutdinov, C. Kratz and A. Furchner, “Brilliant mid-infrared ellipsometry and polarimetry of thin films: toward laboratory applications with laser based techniques”, J. Vac. Sci. Technol. B 37, 060801 (2019). https://doi.org/10.1116/1.5122869
- A. Furchner, C. Kratz, J. Rappich and K. Hinrichs, “Hyperspectral infrared laser polarimetry for single-shot phase–amplitude imaging of thin films”, Opt. Lett. 44, 4893–4896 (2019). https://doi.org/10.1364/OL.44.004893
- M. Hermes, R. Brandstrup Morrish, L. Huot, L. Meng, S. Junaid, J. Tomko, G.R. Lloyd, W.T. Masselink, P. Tidemand-Lichtenberg, C. Pedersen, F. Palombo and N. Stone, “Mid-IR hyperspectral imaging for label-free histopathology and cytology”, J. Opt. 20, 023002 (2018). https://doi.org/10.1088/2040-8986/aaa36b
- D. Perez-Guaita, K. Kochan, M. Batty, C. Doerig, J. Garcia-Bustos, S. Espinoza, D. McNaughton, P. Heraud and B.R. Wood, “Multispectral atomic force microscopy-infrared nano-imaging of malaria infected red blood cells”, Anal. Chem. 90, 3140–3148 (2018). https://doi.org/10.1021/acs.analchem.7b04318
- D. Zhang, C. Li, C. Zhang, M.N. Slipchenko, G. Eakins and J.-X. Cheng, “Depth-resolved mid-infrared photothermal imaging of living cells and organisms with submicrometer spatial resolution”, Sci. Adv. 2, e1600521 (2016). https://doi.org/10.1126/sciadv.1600521
- K.L. Vodopyanov, E. Sorokin, I.T. Sorokina and P.G. Schunemann, “Mid-IR frequency comb source spanning 4.4–5.4 µm based on subharmonic GaAs optical parametric oscillator”, Opt. Lett. 36, 2275–2277 (2011). https://doi.org/10.1364/OL.36.002275
- A. Furchner, C. Kratz and K. Hinrichs, “Sub-second infrared broadband-laser single-shot phase–amplitude polarimetry of thin films”, Opt. Lett. 44, 4387–4390 (2019). https://doi.org/10.1364/OL.44.004387
- R. Azzam, “Multichannel polarization state detectors for time-resolved ellipsometry”, Thin Solid Films 234, 371–374 (1993). https://doi.org/10.1016/0040-6090(93)90288-Z
- J. Qi and D.S. Elson, “A high definition Mueller polarimetric endoscope for tissue characterisation”, Sci. Rep. 6, 25853 (2016). https://doi.org/10.1038/srep25953
- A. Barth, “Infrared spectroscopy of proteins”, Biochim. Biophys. Acta 1767, 1073–1101 (2007). https://doi.org/10.1016/j.bbabio.2007.06.004
- C. Kratz, A. Furchner, T.W.H. Oates, D. Janasek and K. Hinrichs, “Nanoliter sensing for infrared bioanalytics”, ACS Sensors 3, 299–303 (2018). https://doi.org/10.1021/acssensors.7b00902