Nils Kristian Afsetha Matthew Bloomfieldb Jens Petter Wolda and Pavel Matousekb,c
aNofima—Norwegian Institute of Food, Fisheries and Aquaculture Research, PB 210, N-1431 Ås, Norway. E-mail: [email protected]
bCobalt Light Systems Limited, 174 Brook Drive, Milton Park, Abingdon, Oxfordshire, OX14 4SD, UK
cCentral Laser Facility, Research Complex at Harwell, STFC Rutherford Appleton Laboratory, Harwell Oxford, OX11 0QX, UK
Introduction
For several decades, Raman spectroscopy has been considered a potential and promising tool within the area of food analysis. Raman spectroscopy offers a combination of sampling opportunities and chemical specificity that allows for a variety of applications: the spectral information that could be obtained is close and complementary to the information obtainable from mid-infrared spectra, whereas the sampling opportunities, including the ease of using fibre optic probes, are close to the standard non-invasive approaches used in near infrared (NIR) spectroscopy. However, the widespread use of Raman spectroscopy in food analysis, and in biological and medical applications in general, has been hampered by several inherent obstacles. Dominating background signals from fluorescing biomolecules have constituted a part of this challenge, as the analyte Raman scattering frequently is “buried” in this dominating fluorescence signal. Another important challenge has been related to representative sampling. As we all know, foods are notoriously heterogeneous, and instrumental limitations in laser spot sizes of Raman instrumentation have often restricted analysis to be performed only on very small sample spots (often below a diameter of 1 mm). In addition, the conventional Raman backscattering geometry has confined Raman analysis to the near surfaces of a sample.
Recent instrumental developments have provided new possibilities for probing deeper layers of opaque biological materials, for representative analyte sampling and even, to some extent, for the rejection of background fluorescence when originating from near surface layers. These developments have first of all been pushed forward by advances in the fields of pharmaceutical analysis and biomedical diagnostics using Raman spectroscopy. One of these developments has made so-called wide area illumination schemes available, providing laser beam diameters in the range of 3–7 mm, thereby significantly improving sampling volumes and thus the possibilities for representative sampling.1 Commercial instruments offering these capabilities have been available for some time now.
For probing deeper into biological tissue, two emerging sampling approaches are of high interest, namely transmission Raman spectroscopy and Spatially Offset Raman Spectroscopy (SORS).
.")
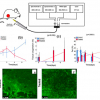
Figure 1 provides a general schematic description of the optical configurations in question. In the normal backscattering configuration (left), Raman scattering excitation and detection is performed at the same sample position. For SORS (middle), acquisition of Raman spectra are undertaken from regions spatially offset on the sample surface from the point of the excitation laser beam. In transmission Raman (right), the excitation laser and the detector are placed on opposite sides of the sample. The latter approach may thus be considered as an extreme version of SORS.
Transmission Raman spectroscopy was explored in the earlier days of Raman spectroscopy, but the approach was “revitalised” in 2006.2 Today, transmission Raman spectroscopy has found multiple applications within pharmaceutical tablet analysis, and the technique is also a promising tool within biomedical diagnostics. For samples of adequate size, transmission Raman spectroscopy could be a highly feasible approach for future food applications. The approach has recently been used to quantify fat and protein contents in single soybeans3 and for compositional analysis of corn kernels.4
The approach of SORS in Raman spectroscopy is similar to the so-called “interactance” approach which is frequently used in NIR spectroscopy for penetrating deeper into biological tissues like meat, whole fruits and vegetables. SORS is capable of isolating Raman spectra of individual sub-layers within a diffusely scattering system, and in the first feasibility study, SORS was used for characterising trans-stilbene powder beneath a 1 mm thick polymer layer.5 Subsequently, the technique has found a range of applications within different fields, from the in vivo analysis of bone to through-packaging analysis in the pharmaceutical field and the analysis of liquid and gel explosives in bottles. Within the field of food analysis, SORS has been used to evaluate the internal maturity of tomatoes6 and, recently, we showed that SORS can be used for qualitative and quantitative characterisation of quality parameters of intact salmon.7
SORS in salmon analysis
For salmon, both the content of fat, the fat composition and the content of carotenoids are important quality parameters. These characteristics are all to a certain degree dependent on the feeding and for farming and breeding purposes these quality features are important control parameters in order to find the best balance between the cost of feeding and maintaining optimal quality for the consumers. Thus, non-invasive tools for assessing quality parameters of live or slaughtered fish would be of major benefit for farming and breeding purposes, and for product quality control. It is known that visible and NIR spectroscopy can be used for predicting fat content and carotenoid concentrations in live and slaughtered salmon.8 The fat content predictions are based on a specific fat absorption band in the NIR region. The carotenoid predictions, on the other hand, are based on the carotenoid absorptions in the visible region, but these measurements are obscured by absorptions in the salmon skin, making the prediction model less robust.
From the Raman spectroscopist’s viewpoint, salmon skin poses a significant challenge. The colour of salmon skin varies from light grey to almost completely black, and whereas conventional Raman might be expected to yield good quality spectra of the light parts of the skin, spectra of the dark part could be expected to be dominated by background fluorescence, and the penetration depths could be expected to be low. However, the approach of SORS is actually a practically feasible approach for obtaining Raman spectra of the quality features of salmon flesh beneath the salmon skin.

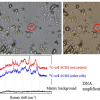
This is shown in Figure 2, where intact salmon samples were measured at different spatial offsets, including zero mm offset, through the dark skin of the salmon. For this study, an excitation laser of 830 nm was used. At zero spatial offset (labeled “Conv. Raman”), which is equivalent to the conventional backscattering geometry, the dominating features of the spectrum are background fluorescence and broad spectral features most likely related to the proteins and pigments (e.g. melanin) of the salmon skin. In addition, the broad feature in the region 350—500 cm–1 arises from silica from the fibre-optic probe. At 1 mm and 2 mm spatial offsets, no apparent changes are seen, but at 3 mm and 4 mm spatial offsets, Raman bands related to the fish flesh start to appear in the spectra. The four most prominent peaks, which are observed in the region 1800–1200 cm–1, are all mainly related to the lipid components of the salmon flesh. At 5 mm and 6 mm spatial offsets, these bands become even more prominent, and these offset positions thus mark optimal choice SORS distances for Raman measurements through dark salmon skin.
For measurements through the light part of the skin, these measurements are distinguishable from the dark skin measurements in two ways: the light salmon skin has a more distinct spectral signature than the black skin, and it could be expected that light skin is easier to penetrate than the dark skin. Thus, already at 2 mm offset, a clear profile of the lipid bands of the salmon flesh is observable in the spectra, but in general, the spectra show the same dependency of the offsets as was observed in Figure 2.
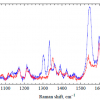
 and light (blue curve) salmon skin, respectively. Important bands have been denoted P (pigments) or L (lipids), respectively. Reproduced from Reference 7 with permission from the Society of Applied Spectroscopy.")
In Figure 3, mathematically preprocessed SORS spectra of salmon tissue obtained at 6 mm offset through dark and light skin, respectively, are compared. As can be seen, the two spectra are clearly comparable and the presentation thus shows that when the SORS offsets used are sufficiently large, the main information provided in the spectra are related to the actual salmon flesh, and not to the type of skin. In addition, the spectra provide clearer evidence of the pigmentation of the salmon flesh, which are naturally occurring carotenoids. It should also be noted that all spectra in Figures 2 and 3 have been normalised for clarity. In general, if the offset is increased, the number of photons finding their way back to the detector will be decreased. Thus, choosing the right offset will always be a balance between sufficient offset to penetrate the upper surface layer and obtaining the adequate signal-to-noise ratios of the recorded spectra.
The SORS approach for salmon analysis is not limited to qualitative characterisation. Our preliminary studies also show that quantitative information could be obtained from the salmon tissue beneath the salmon skin. In fact, by employing model systems, quantitative information related to carotenoids and lipid composition could be revealed from the SORS spectra.7 This is very important for the potential future use of the approach, and for quantitative SORS analysis of foods in general. In all SORS spectra used in the present study, a basic mathematical pretreatment for background removal and normalization of spectra known as Extended Multiplicative Signal Correction was used. A new MATLAB-based graphical interface for this correction method can be downloaded at http://nofimaspectroscopy.org.
Outlook
The present study illustrates the potential of employing SORS for the qualitative and quantitative characterisation of quality parameters of intact salmon. A crude estimate suggests that information from around 5 mm beneath the surface area could be obtained using SORS, and in order to further develop this application, representative sampling spots on a salmon need to be identified, i.e. the spots on the salmon that could give some overall information on carotenoid concentration and fatty acid composition. What is also equally important, is that the study shows the potential of using SORS qualitatively and quantitatively for sub-surface probing of quality parameters in biological matrices. As this and other Raman sampling approaches are further explored, we could thus expect to get significantly closer to fulfilling the true potential of Raman spectroscopy for analysis of foods and other biological matrices.
Acknowledgements
The Norwegian foundation for research levy on agricultural products is greatly acknowledged.
References
- H. Wikstrom, I.R. Lewis and L.S. Taylor, “Comparison of sampling techniques for in-line monitoring using Raman spectroscopy”, Appl. Spectrosc. 59(7), 934–941 (2005). doi: http://dx.doi.org/10.1366/0003702054411553
- P. Matousek and A.W. Parker, “Bulk Raman analysis of pharmaceutical tablets”, Appl. Spectrosc. 60(12), 1353–1357 (2006). doi: http://dx.doi.org/10.1366/000370206779321463
- M.V. Schulmerich, M.J. Walsh, M.K. Gelber, R. Kong, M.R. Kole, S.K. Harrison, J. McKinney, D. Thompson, L.S. Kull and R. Bhargava, “Protein and oil composition predictions of single soybeans by transmission Raman spectroscopy”, J. Agric. Food Chem. 60(33), 8097–8102 (2012). doi: http://dx.doi.org/10.1021/jf301247w
- J. Hwang, S. Kang, K. Lee and H. Chung, “Enhanced Raman spectroscopic discrimination of the geographical origins of rice samples via transmission spectral collection through packed grains”, Talanta 101, 488–494 (2012). doi: http://dx.doi.org/10.1016/j.talanta.2012.10.001
- P. Matousek, I.P. Clark, E.R.C. Draper, M.D. Morris, A.E. Goodship, N. Everall, M. Towrie, W.F. Finney and A.W. Parker, “Subsurface probing in diffusely scattering media using spatially offset Raman spectroscopy”, Appl. Spectrosc. 59(4), 393–400 (2005). doi: http://dx.doi.org/10.1366/0003702053641450
- J.W. Qin, K.L. Chao and M.S. Kim, “Nondestructive evaluation of internal maturity of tomatoes using spatially offset Raman spectroscopy”, Postharvest Biol. Tech. 71, 21–31 (2012). doi: http://dx.doi.org/10.1016/j.postharvbio.2012.04.008
- N.K. Afseth, M. Bloomfield, J.P. Wold and P. Matousek. “A novel approach for subsurface through-skin analysis of intact salmon using spatially offset Raman spectroscopy (SORS)”, Appl. Spectrosc. 68(2), 255–262 (2014). doi: http://dx.doi.org/10.1366/13-07215
- A. Folkestad, J.P. Wold, K.A. Rorvik, J. Tschudi, K.H. Haugholt, K. Kolstad and T. Morkore, “Rapid and non-invasive measurements of fat and pigment concentrations in live and slaughtered Atlantic salmon (Salmo salar L.)”, Aquaculture 280(1–4), 129–135 (2008). doi: http://dx.doi.org/10.1016/j.aquaculture.2008.04.037