Roumiana Tsenkova
Bio Measurement Laboratory, Kobe University, Japan. E-mail: [email protected]
DOI: https://doi.org/10.1255/sew.2010.a1
Dynamic spectroscopy to explore water as a system
Interaction brings knowledge. Spectroscopy has increasingly becoming a very important source of information in various fields, especially in biology. Water is the most substantial and widely distributed, but yet not well understood, component of biological systems. Its role is a complex subject which has received considerable attention over the years; numerous papers in many scientific areas have been published on its properties, structure and functions. As a major building block and functional element of structures at various scales, from galaxies and planets to molecules and cells, water deserves special attention.
To unravel its peculiarities, a systematic analysis approach to water is required. One possible way to explore water1 is through the “prism” of biological or aqueous systems where water is the matrix, the “connective medium”, which binds and interacts with the system. “System” in this context means lots of elements and their interactions, which evolve over time; therefore the temporal dynamics of the system must be considered. Shining light through the “prism” results in a spectrum. Spectroscopy is able to identify all components in the system simultaneously and in a very “epigenetic” way, i.e., “paying attention” to the environment of each absorbance band. Non-invasive spectral monitoring of a whole biological or aqueous system under various perturbations has enormous potential to unravel the “mystery” of water within a system at the molecular level.
Why use near infrared spectroscopy?
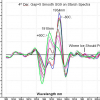
Water is a strong absorber of UV and infrared (IR) energy. As shown in Figure 1, it absorbs over a very wide region of the electromagnetic (EM) spectrum, from 100 nm to 100 µm. Its absorbance is much lower in the overtone region around 700–2500 nm, i.e., the near infrared (NIR) spectral region.2 Characteristic absorbance features occur in this region and can be measured at longer path-lengths than in the mid-IR region. These measurements can be non-invasive, very fast and do not require extensive sample preparation. Time-resolved dynamic NIR spectroscopy enables monitoring chemical bonds changing in a system under perturbation. Thus, water molecular vibrations can be observed and analysed in relation to other molecular vibrations and as functions of the whole system. Each spectrum of such a system depicts the light absorbance at various wavelengths according to the contribution (concentration and structure) of each molecular member of the system. In addition, NIR spectra contain physical information, such as contributions from scattering, and NIR spectra are highly influenced by temperature and pH.
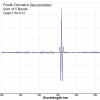
")
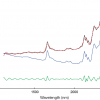
The NIR spectrum of water presents two dominant broad peaks known as the first and second overtones and a few other distinct but smaller peaks, known as combination water band peaks (Figure 2). The overtone spectral region usually contains many overlapping bands. Therefore, raw NIR absorbance spectra do not present single absorbance bands as isolated Gaussian curves. To unravel information for single molecules or structures, multivariate analysis and other data mining approaches are required. The overtones of characteristic fundamental bands are calculated and further used for assignment when analysing the spectral patterns of biological and aqueous systems with overtone spectroscopy.
 of Water Matrix Co-ordinates, WAMACS.")
NIR spectroscopy of aqueous systems
Distinct water configurations, for example dimers, trimers, solvation shells etc., are known to contribute very specifically to its NIR spectrum. They are very sensitive to the configuration and charges of the solvated molecules or clusters. Therefore, the NIR spectrum of the solvent (i.e. water) has been found to contain significant information about its solutes. In our laboratory, protein solutions, biomolecular water solutions, suspensions of small particles in water and various biological systems such as cells, plants, animal body fluids and tissues have been analysed with NIR spectroscopy.1 In these studies, well-known water absorbance bands were observed under various perturbations (i.e. concentrations of solutes, concentrations of nano particles of various sizes, concentrations of molecules which don’t absorb light in the NIR range, temperature, light illumination etc.). Dynamic spectra were acquired and analysed with multivariate methods. As a result, numerous water absorbance bands were identified. Many of these bands were in a good agreement with previously reported or calculated overtones of already published water bands in the IR region. Some of them were newly discovered.1
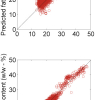
In research carried out at our laboratory, water was perturbed with lactose, human serum albumin (HSA), different isomers of prion protein (PrP), NaCl, vitamin C and other solutes at various concentrations. The most prominent wavelengths identified in the spectra through multivariate analysis were mainly water absorbance bands. Contrary to the common understanding of overtone spectroscopy (100–1000 times lower absorbance than in the mid-IR range), it was shown that even very small concentrations (ppb level)3,4 of the solute could be measured with NIR. When the first overtone of the water absorbance region at 1300–1600 nm was used to develop a model for low concentration (1–0.0001%) measurement of polystyrene particles, spectral measurements achieved high accuracy over a wide region of concentrations. The accuracy decreased substantially when only the polystyrene overtone band at 1680 nm was used. Similar findings were reported for proteins in solution, metals in solution etc. Another study has shown that NIR spectral models for metal concentration measurement (ppb range) in diluted samples are influenced by the method of dilution (serial or direct dilution). These findings led to the conclusion that the NIR water spectral pattern describes the water matrix in relation to the rest of the molecules in solution in great detail. For the first time, water was discussed as the common spectral denominator of aqueous and biological systems.5 In order to systemise the already abundant information concerning the interactions of water in biological and aqueous systems with light at various frequencies, predominantly in the NIR region, a new scientific area called “Aquaphotomics” has been proposed by the Biomeasurement Laboratory of Kobe University, Japan.

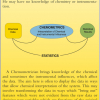
Aquaphotomics
Aquaphotomics (see Figure 3) is a new term1 introduced to describe the concept of approaching water as a multi-element system that could be well described by its multi-dimensional spectra. Technologies utilising UV, NIR (overtone spectroscopy), IR, Raman and THz spectroscopy allow time-resolved and non-invasive measurements of aqueous systems. Multivariate spectral analysis of the data resulting from these measurements provides an immense source of information systematised into a database of water absorbance bands called the Aquaphotome. For dynamic, non-invasive studies, NIR spectroscopy has proved to be a powerful tool and source of information and, therefore, it facilitated the establishment of Aquaphotomics (all about the water–light interaction). The water–light interaction at each frequency of the entire electromagnetic spectrum measured for a whole biological or aqueous system is discussed by researchers using these techniques as a potential source of information aimed at a better understanding of water and the biological world. Aquaphotomics, as an “omes and omics” concept, is a result of high throughput experimental analyses. Information about water absorbance bands and absorbance patterns could provide a distinctive knowledge of water structures and intrinsic interactions between water and other components of the aqueous system. Through an understanding of water–light interaction dynamics and its relation to biological functions, aquaphotomics brings together the knowledge acquired by other -omics disciplines such us genomics, proteomics, metabolomics etc. that describe single elements of biological systems. Aquaphotomics upgrades this knowledge to a system level as water does in biology and aqueous systems.
Aquaphotomics has been developed using a deductive approach. It has two main goals:
- To expand knowledge about the interaction between water and electromagnetic radiation; knowing all possible bands and spectral regions (water matrix coordinates, WAMACS) where water interacts with light and, thus could be monitored.
- To use the water absorbance patterns, WAPS, based on WAMACS and related to water structure and functionalities in various systems, in order to deduct information about water/system peculiarities.
Aquaphotomics vocabulary
Water has been studied by different disciplines in many different ways. All of them use their own particular terminology and sometimes it is quite difficult to translate scientific findings from one area in to another. Aquaphotomics provides an opportunity to start building up a “water vocabulary” in order to translate findings about water among different disciplines.
Water matrix co-ordinates, WAMACS1
Water bands can be identified in two ways: experimentally and by calculations of the overtone frequencies of already assigned water bands. Experimental identification of water bands in the NIR wavelength range relies on multivariate data analysis. These can be related to overtone bands calculated from observed fundamental bands. Once a large database of characteristic water absorbance bands has been acquired, they will be related to specific biological functions, structures etc., and used for understanding biology, chemistry and physics of water and other aqueous systems.
Water absorbance patterns, WAPS1
As water is very easily influenced by various factors (e.g. temperature, ion concentration), it has been proposed to use the spectral changes of studied aqueous and biological systems under defined perturbation to learn more about the water matrix and the rest of molecules that are surrounded by water. Characteristic spectral patterns presenting the water absorbance bands activated by respective perturbation and the “weight” of each band in the regression equation of studied aqueous and biological systems, under defined perturbation is called a Water Absorbance Pattern, WAP.
Aquagram
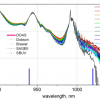
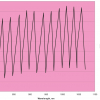
The Aquagram, Figure 4, is a star chart displaying normalised water absorbance of already known water bands represented on axes starting from the same point. This chart shows observations under defined perturbation. Each axis represents relative values for all the compared observations at the same absorbance band. The chart depicts water absorbance patterns, WAPS, for respective perturbation or physiological conditions of biological systems. With Aquagrams it is easy to find outliers, i.e. abnormalities in the system described by their spectrum and especially by the respective water absorbance pattern.
 found under the “envelope” of the first overtone of water.")
Aquaphotome1
The water absorbance bands of a system found under perturbation define the respective Aquaphotome, a database of characteristic water absorbance bands specific for each particular system and perturbation. The entire Aquaphotome is a cumulative database of all the Aquaphotomes that are unique for each system. For example, the Aquaphotomes of milk, blood, urine, tissue etc. of a dairy cow will, when combined, present the Aquaphotome of a dairy cow. The Aquaphotome is the entire complement of water molecules’ absorbance bands of aqueous and biological systems, i.e. comprehensive spectral assignment of all existing water absorbance bands over the entire electromagnetic spectrum.
Extended water mirror approach, EWMA
In order to describe natural phenomena related to water and for their better understanding, Aquaphotome development in the NIR range could be described as writing the alphabet of “water–light” interaction, where WAMACS would be the letters and the WAPS would be the words. Having such an “alphabet”, any perturbation (chemical, physical or of any other nature) could be well defined using the “letters” of water. Within the water matrix the vast amounts of hydrogen bonds that could be “seen” with NIR light reflects any molecule embedded in it like a mirror.5 We call it a three-dimensional water mirror (Aquamirror on a molecular level) as with the contemporary technology, it is becoming possible to acquire a pixel spectrum in a 3D matrix.
The future
We still don’t fully understand the role of water and light in the biological world, but we know that NIR light is able to probe even objects with high water content such us biological systems. This makes it possible to acquire spectral data and perform real time non-destructive analyses, i.e. register spectral variations and discover new water absorbance bands, water letters, in an immense number of systems. It is intriguing how many “letters”, i.e. characteristic water molecular vibrations and how large a “vocabulary” is needed to describe the role of water in the biological world; an extended amount of work remains to be accomplished.
References
- R. Tsenkova, J. Near Infrared Spectrosc. 17, 303–314 (2009).https://doi.org/10.1255/jnirs.869
- J. Workman Jr, in Handbook of organic compounds: NIR, IR, Raman and UV-Vis spectra featuring polymers and surfactants, Volume 2. Academic Press, San Diego, USA, p. 168 (2001).
- A. Sakudo, R. Tsenkova, T. Onozuka, K. Morita, S. Li, J.Warachit, Y. Iwabu, G. Li, T. Onodera and K. Ikuta, Microbiol. Immunol. 49(7), 695–701 (2005).https://doi.org/10.1111/j.1348-0421.2005.tb03648.x
- A. Sakudo, R. Tsenkova, K. Tei, T. Onozuka, K. Ikuta, E. Yoshimura and T. Onodera, Biosci. Biotechnol. Biochem. 70, 1578–1583 (2006).https://doi.org/10.1271/bbb.50619
- R. Tsenkova, in Proceedings of the 12th International Conference on Near-infrared Spectroscopy, Ed by G.R. Burling-Claridge, S.E. Holroyd and R.M.W. Sumner. The New Zealand Near Infrared Spectroscopy Society Inc., Hamilton, New Zealand, pp. 607–612 (2007).