A.M.C. Daviesa and Tom Fearnb
aNorwich Near Infrared Consultancy, 10 Aspen Way, Cringleford, Norwich NR4 6UA, UK. E-mail: [email protected]
bDepartment of Statistical Science, University College London, Gower Street, London WC1E 6BT, UK. E-mail: [email protected]
Introduction
When we started working with regression analysis (around 35 years ago!), multiple linear regression (MLR) was the most sophisticated method available. At that time we did not have many variables (TD was working with chromatographic data, while TF was investigating biscuits). “t tests” could be used to decide which variables should be utilised. We both then became involved with near infrared (NIR) data and have stayed with it. At first we both had data from simple filter instrument with 6–19 filters and could continue with t-tests. Then commercial NIR grating spectrometers became available and we had 700 variables! Life became much more difficult!
The first two solutions were principal component regression (PCR) and partial least squares (regression) (PLS); these are similar methods which use all the variables to form a small number of new variables (factors) so the decisions of how many or which variables to use are nicely side-stepped. There is very little to choose between the performances of these methods, but commercial PLS software was developed more quickly, which was the major factor for PLS becoming the method of choice. This took time, PLS and PCR were first demonstrated in NIR applications towards the end of the 1970s, but PLS did not gain its dominance until the 1990s. Several groups had worked on the problem of variable selection in the period 1975–1990. We could fill a page with references! However, in our book1 we give details of some of the many methods which search for the “best” subset and of the use of Fourier and wavelet transformation, artificial neural networks (ANNs) and generic algorithms (GA).
Currently many calibration developers are happy with PLS, which now has a good history of successful application and it is seen as a “safe bet”. Some developers may be aware that researchers do not regard PLS as the end of the story, but researchers have time to think about these matters. Developers are paid to get reliable results, and for most data sets they cannot be fairly criticised for using PLS.
The perceived problem with PLS is that it uses all the variables in every factor. In any given calibration some of the variables may be very important in one factor but not in others, but all are included in every factor. The influence of a variable on the prediction result depends on the size of the coefficient computed by PLS. If the coefficient is very small then it will have very little effect on the result except that every variable will add a small noise component. Thus predictions produced by PLS calibrations must have more than the minimum of added noise. If it was possible to include variables in PLS only when they made a useful contribution to the precision of the predicted result then some of this noise could be excluded. A recent paper in the Journal of Near Infrared Spectroscopy (JNIRS)2 has compared some of the more recent techniques of variable selection, with PLS as the benchmark. One of them, powered partial least squares (PPLS),3 gave significantly better results on three different data sets compared to other methods.
Powered partial least squares
Powered partial least squares (PPLS) is a modification of the NIPALS algorithm, which was one of the earliest of the many algorithms that now exist for PLS. The modification concerns the computation of the loading weights, which determine the contributions of the original variables to each factor. In the standard algorithm these loading weights are proportional to the covariances between the dependent variable y and the predictors. PPLS gives more weight to the correlations, with an extra tuning parameter to control this weight. For values of this tuning parameter close to 1, the effect is to drive the loading weights for many of the variables to zero, effectively causing these variables to be eliminated. The variables that survive will be the ones with strong (simple) correlations with y.
Experimental
The paper used published data for fat in animal feed and fibre and protein in different maize databases. Spectra were pre-processed using the standard normal variate (SNV) method.4 The extra PPLS parameter was set to automatically optimise in the range 0.99–1.0. Calibrations for each constituent were obtained while varying the number of calibration samples from 20 to 200. The results, in terms of R2 and number of selected samples, are plotted in Figures 1–3. These clearly demonstrate the superiority of the PPLS program over standard PLS for these particular examples when the number of available calibration samples is low or moderate.
 between measured and predicted fat in compound animal feed as a function of the number of calibration samples. Lower plot: number of variables selected by the PPLS program. Adapted with permission from Figure 1 in Reference 2; © 2012 IM Publications LLP.")
 between measured and predicted fibre in maize as a function of the number of calibration samples. Lower plot: number of variables selected by the PPLS program. Adapted with permission from Figure 2 in Reference 2; © 2012 IM Publications LLP.")
 between measured and predicted protein in maize as a function of the number of calibration samples. Lower plot: number of variables selected by the PPLS program. Adapted with permission from Figure 3 in Reference 2; © 2012 IM Publications LLP.")
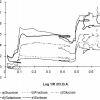
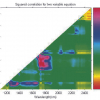
Figures 4–6 show which variables were selected over the 19 iterations with increasing numbers of calibration samples. These selections are compared to the mean spectrum of the database in use. The selections are readily interpreted from knowledge of NIR absorptions of the functional groups of the different analytes which gives added confidence in selection process.


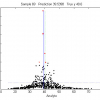
An example of this improvement is shown in Figure 7, which shows the improvement obtained in the fat in animal feed calibration with 60 samples made available for the calibrations. PLS gave an R2 value of 0.78 for the prediction of 2521 samples of animal feed; while PPLS gave a value of 0.93.

Conclusions
Most NIR calibrations start with a fairly small database of analysed samples, so PPLS would appear to be a very useful extension of PLS. I would be surprised (and disappointed) if we do not find it in commercial software in the near future. It would be a fitting tribute to our friend and colleague, Tomas Isaksson, who died tragically early, soon after the publication of the JNIRS paper.
Is this the end of the search for the ultimate variable selection method? That is very unlikely!
References
- T. Næs, T. Isaksson, T. Fearn and T. Davies, A User Friendly Guide to Multivariate Calibration and Classification. NIR Publications, Chichester, Chapter 10 (2002). http://www.impublications.com/shop/a-user-friendly-guide-to-multivariate-calibration-and-classification.html
- S.I. Øvergaard, J.A. Fernández, V. Baeten, P. Dardenne and T. Isaksson, “Prediction error improvements using variable selection on small calibration sets—a comparison of some recent methods “, J. Near Infrared Spectrosc. 20, 329 (2012). doi: 10.1255/jnirs.996
- U. Indahl, “A twist to partial least squares regression “, J. Chemometr. 19, 32 (2005). doi: 10.1002/cem.904
- A.M.C. Davies and T. Fearn, “Back to basics: The ‘final’ calibration“, Spectroscopy Europe 19(6), 24 (2007). link: http://bit.ly/WwSUhN