Manfred Schwanninger,a,* Barbara Stefkeb and Barbara Hinterstoisserb,c
aDepartment of Chemistry, University of Natural Resources and Life Sciences, Vienna, Muthgasse 18, A-1190 Vienna, Austria. E-mail: [email protected]
bCompetence Centre for Wood Composites and Wood Chemistry (Wood K plus), St Peter Strasse 25, A-4021 Linz, Austria
Wood and wood modification
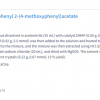
Wood is an important renewable, industrially valuable resource and, due to its high specific strength to weight ratio, it is preferred as a building and engineering material. Even though nature provides a very broad spectrum of material properties due to the natural variability of wood species, for technological uses there are some limitations such as photosensitivity and combustibility. Moreover, a harmonisation of wood properties is also often desired in order to avoid swelling and shrinking and to improve biodegradability, especially when wood is to be exposed to moisture. Methods such as chemical modification that cause a decrease in the degradation rate by modifying the basic chemistry of the cell wall polymers could help to enhance wood’s utility. In addition to providing dimensional stability and decay resistance to fungi, photodegradation by UV radiation is reduced and the mechanical properties of wood and its hydrophilicity are improved by acetylation. Acetylation (with or without catalysts) of each wood component is described as a substitution reaction of the hydrophilic –OH group by the hydrophobic acetyl group. The initial step includes a nucleophilic attack of the lone electron pair of the alcoholic or phenolic wood –OH group on the carbonyl carbon atom of the acetic anhydride molecule (Scheme 1). Due to the consequent split-off of acetic acid, the acetylated (esterified) wood component results.

Infrared spectroscopy
Mid-infrared Fourier transform infrared (FT-IR) spectroscopy is a well-known powerful analytical tool for detecting specific functional groups by measuring fundamental molecular vibrations. In particular, carbonyl groups (for example, ester groups), which have a high molar absorptivity, can be detected easily, even when only present in low numbers of groups. Therefore, for characterising and following the acetylation of wood, mid-IR FT-IR spectroscopy has quite often been used.1,2
Alternatively, near infrared (NIR) spectroscopy—a rapid and non-destructive method—can be used, as absorption bands arise from overtones and combination bands caused by molecular vibrations of C–O, O–H, C–H and N–H groups, which have their fundamental molecular vibrations in the mid-infrared region. The absorption signals of various constituents are connatural and highly overlapping; therefore, in many cases, no distinct band directly related to the chemical abundance of a single wood constituent can be observed.3 Nevertheless, the feasibility of using NIR spectroscopy to predict chemical and physical properties of wood has been proven and reviewed,4,5 including band assignments.6 Since, in the various cases, the chemical information is hardly selective from within the typically broad and extensively overlapping bands of NIR spectra, multivariate analysis techniques have to be used to model data relevant in information for classification and prediction of the desired wood properties.2,7,8
Spectral changes due to acetylation
The increasing number of acetyl groups of wood due to acetylation with acetic anhydride—often expressed as weight percentage gain (WPG)—has been analysed by means of mid-IR FT-IR and FT-NIR spectroscopy.2 In the mid-IR region, a continuous increase in the intensities of specific bands can be observed due to an increase in the WPG and the increasing number of acetyl groups respectively resulting in acetylation of wood; these occur mainly at 1745 cm–1, 1374 cm–1 and at 1240 cm–1.2 These bands are assigned to molecular vibrations of acetyl C=O groups (1745 cm–1), aliphatic C–H deformation vibrations of the CH3 group (1374 cm–1), the antisymmetric C–O stretching vibration from the grafted ester group (C–O–C=O at 1240 cm–1) and, additionally, C–C plus C–O stretching9 plus aromatic =C–H in-plane deformation vibrations (1265 cm–1 from lignin, which is overlapped by the latter one with increasing the number of acetyl groups) as well as the C–O valence vibration (1030 cm–1) from cellulose, hemicelluloses and lignin.2 These findings have allowed us to confirm results from other studies, including the accessibility and reactivity of the hydroxyl groups. Furthermore, it has been shown that, with increasing WPG, aromatic esters are formed which can be distinguished from the alkyl esters in the mid-IR FT-IR spectrum.2
Corresponding increase and decrease of bands in the NIR spectra resulting from acetylation exhibit their most obvious increase in the range from 6100 cm–1 to 5700 cm–1, assigned to the first overtone of C–H stretching vibrations from the methyl group of the acetyl group and, to a lesser extent, in the range from 8700 cm–1 to 8400 cm–1, assigned to the second overtone of C–H stretching vibrations.2 Reducing the number of hydroxyl groups by acetylation, a decrease in intensity of bands between 7000 cm–1 and 6500 cm–1, assigned to the first overtone of O–H stretching vibrations, was expected and observed.
Unfortunately, within the NIR region, one cannot observe an intense C=O band as is observed in the mid-IR region. The first overtone of the C=O stretching vibration is found in the mid-IR region (3600–3330 cm–1). The second overtone (5300–5100 cm–1) gives rise to a weak signal in the NIR region, which is overlapped by the much stronger water absorption band (5400–4800 cm–1), although this decreases with the increasing degree of acetylation. A closer look at the water band reveals a shift from about 5185 cm–1 to 5242 cm-1, which can be followed by NIR spectroscopy. Free water with no –OH group involved in hydrogen bonding appears at about 5215 cm–1. The shift at high wood moisture content is small, as is the overall contribution to the whole water peak. Therefore, according to the spectra, it seemed likely that this band at about 5242 cm–1 is due to the second overtone of the C=O stretching vibration from the acetyl ester.2
Quantification of the WPG
Band height ratios (BHRs) [1240/1030 (1230/1030) and 1745/1030 (1740/1030)] of the bands at 1745 cm–1 (1740), 1240 cm–1 (1230) and 1030 cm–1 were calculated from mid-IR FT-IR spectroscopic measurements, both in transmission using KBr disks and ATR (attenuated total reflection) spectra. A good linear correlation with a coefficient of determination of about 0.94 valid for a range from 0% to 27% WPG between BHRs with both WPG and acetyl content, requires only a few samples to calibrate the mid-IR FT-IR measurement.10 This means that a fast method for the determination of WPG can be obtained at low cost.
Partial least squares regression (PLS-R) models based on second derivatives of the NIR-spectra over the wavenumber range from 6080 cm–1 to 5760 cm–1 resulted in a coefficient of determination of 0.99, utilising a number of PLS components between 3 and 5 and with a root mean square error of cross-validation between 0.6% and 0.79% and a residual prediction deviation up to 10. Although a wide range of input parameters (i.e. various wood species, different procedures of acetylation) was used, highly satisfactory results were obtained.10 Both mid-IR FT-IR and FT-NIR spectroscopic methods fulfil the needs for determining the WPG and the acetyl content of acetylated wood. By reason of its additional potential for on-line process control, the FT-NIR method may even be preferred to the mid-IR FT-IR approach.
Separation of wood species
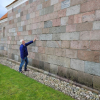
Rectangular shaped specimens (95 mm × 20 mm × 1 mm) of spruce [Picea abies (L.) Karst] (42 specimens), pine (Pinus sylvestris) sapwood (39) and heartwood (32) veneers were prepared and dried at 105°C for 12 h, stored in a desiccator over silica gel to cool to room temperature and weighed to get the oven-dry mass (mod) of each specimen.
The acetylation started (after removing silica gel) with connecting the evacuated desiccator (30 min evacuation at about 11 mbar) to a storage flask of acetic anhydride. This allowed acetic anhydride to be sucked into the desiccator as well as into the voids of the specimens. Thereafter, the impregnated strips were transferred into a 4 L reaction flask filled with 1.5 L pure acetic anhydride (Sigma–Aldrich). Counting of the minutes of acetylation (15 min to 270 min) started when the reaction temperature of 110°C was reached. After acetylation and cooling of specimens, they were washed and extracted with cold water until the acetic acid was removed, then they were dried and weighed again to obtain the mass of the acetylated specimen (mac). The achieved WPG (between 9.3% and 20%) was calculated according to:
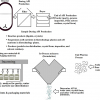
NIR diffuse reflection spectra were collected from the veneer surfaces over the wavenumber range from 10,000 cm–1 to 5100 cm–1 at a resolution of 8 cm–1, averaging 100 scans for a spectrum, with an Equinox 55 spectrometer (Bruker Optics) equipped with a NIR-spectroscopy compartment and a fibre-optic probe. Six spectra, at random positions on the front and back sides of each veneer, were collected and averaged using OPUS software (Bruker Optics). Second derivatives of the spectra were calculated using the Savitzky–Golay algorithm using a second order polynomial filter with 17 point smoothing using The Unscrambler software (Camo, Norway); this was also used for principal component analysis (PCA) of the second derivatives of the spectra over the wavenumber range from 6300 cm–1 to 5500 cm–1.
The scores plot [Figure 1(a)] of the principal components PC1 and PC2, which account for 95% and 3% of the spectral variations of the second derivatives of the NIR spectra, respectively, shows a pattern separated according to the increasing acetylation time (15 min to 270 min) and increasing WPG along PC1. The corresponding loadings plot [Figure 1(b)] reveals the wavenumbers and, therefore, changes in functional groups—increasing number of methyl groups—that are responsible for this pattern. The positive amplitudes at about 6002 cm–1, 5950 cm–1, 5810 cm–1 and 5660 cm–1–first overtone of C–H stretching vibrations2—in Figure 2(b)–indicate lower numbers in less acetylated samples.
 Scores plot (PC2–PC1) and (b) the PC1 loadings plot. Samples: spruce (blue), pine sapwood (green) and pine heartwood (red). The numbers on (a) indicate the acetylation times.")
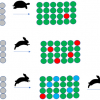
The scores plot [Figure 2(a)] of the principal components PC1 and PC2, which account for 95% and 3% of the spectral variations of the second derivatives of the NIR spectra, respectively, shows separation according to the species/wood type along PC2. The positive loading at about 6280 cm–1 could indicate a slightly higher degree of cellulose crystallinity, while the one at about 5990 cm–1 could indicate a higher extractives content in pine heartwood compared to pine sapwood.6 The ones occurring at about 5830 cm–1 and 5800 cm–1 could indicate small differences in hemicelluloses composition as well as small differences in the degree of acetylation.6
 Scores plot (PC2–PC1), (c) scores plot (PC3—PC1) and the corresponding PC2 (b) and PC3 (d) loadings plots, respectively. Samples: spruce (blue), pine sapwood (green) and pine heartwood (red).")
The separation of spruce from pine wood along PC3 (1%) [Figure 2(c)] is attributed to the amplitudes at 6180 cm–1 and 6060 cm–1, which cannot be assigned, and those at 5780 cm–1 and 5760 cm–1 assigned to the first overtone of C–H stretching vibrations from methylene groups of cellulose or hemicelluloses.6 The assignment of the those remaining is still under investigation. Nevertheless, a separation of pine wood from spruce wood and, additionally, from spruce wood and the pine wood types—heartwood and sapwood—was possible by using PCA, which enables the identification of wood species/types by NIR spectroscopy even after acetylation.
Conclusions
The feasibility of using infrared spectroscopy for monitoring chemical changes due to acetylation, as well as the possibility of quantification of the weight percentage gain, based on band height ratios of mid-IR spectra or partial least squares regression models of NIR spectra, was described. In addition, it was shown that PCA allows the separation/identification of wood species/type, even after acetylation.
References
- N. Özmen, N.S. Çetin, P. Tingaut and G. Sèbe, “A new route for the functionalisation of wood through transesterification reactions”, Eur. Polym. J. 42, 1617 (2006). doi: 10.1016/j.eurpolymj.2006.01.020
- M. Schwanninger, B. Stefke and B. Hinterstoisser, “Qualitative assessment of acetylated wood with infrared spectroscopic methods”, J. Near Infrared Spectrosc. 19, 349 (2011). doi: 10.1255/jnirs.942
- J.S. Shenk, J.J. Workman and M.O. Westerhaus, “Application of NIR spectroscopy to agricultural products”, in Handbook of Near-Infrared Analysis, Ed by D.A. Burns and E.W. Ciurczak. Marcel Dekker Inc., New York, USA, p. 419 (2001).
- S. Tsuchikawa, “A review of recent near infrared research for wood and paper”, Appl. Spectrosc. Rev. 42, 43 (2007). doi: 10.1080/05704920601036707
- S. Tsuchikawa and M. Schwanninger, “A review of recent near infrared research for wood and paper (Part 2)”, Appl. Spectrosc. Rev. 48, 560 (2013). doi: 10.1080/05704928.2011.621079
- M. Schwanninger, J.C. Rodrigues and K. Fackler, “A review of band assignments in near infrared spectra of wood and wood components”, J. Near Infrared Spectrosc. 19, 287 (2011). doi: 10.1255/jnirs.955
- N. Gierlinger, M. Schwanninger, B. Hinterstoisser and R. Wimmer, “Rapid determination of heartwood extractives in Larix sp. by means of Fourier transform near infrared spectroscopy”, J. Near Infrared Spectrosc. 10, 203 (2002). doi: 10.1255/jnirs.336
- K. Fackler, M. Schwanninger, C. Gradinger, B. Hinterstoisser and K. Messner, “Qualitative and quantitative changes of beech wood degraded by wood rotting basidiomycetes monitored by Fourier transform infrared spectroscopic methods and multivariate data analysis”, FEMS Microbiol. Lett. 271, 162 (2007). doi: 10.1111/j.1574-6968.2007.00712.x
- O. Faix, “Classification of lignins from different botanical origins by FTIR spectroscopy”, Holzforschung 45, 21 (1991). doi: 10.1515/hfsg.1991.45.s1.21
- B. Stefke, E. Windeisen, M. Schwanninger and B. Hinterstoisser, “Determination of the weight percentage gain and of the acetyl group content of acetylated wood by means of different infrared spectroscopic methods”, Anal. Chem. 80, 1272 (2008). doi: 10.1021/ac7020823