Karin Engströma and Kim H. Esbensenb
aPhD Student & Method development engineer in sampling and analytical test methods
bKHE Consulting (www.kheconsult.com) & Guest professor (Denmark, Norway, Puerto Rico)
This feature forms an intermezzo in the current segment of process sampling columns. We have asked Karin Engström, Luossavaara Kiirunavaara AB (LKAB), Kiruna, Sweden to outline how industrial validation of a process sampling system takes place following ISO standards guidelines. These prescribe a rigorous procedure for comparison of a process sampling system with a “stopped belt” + manual sample extraction reference system as a means for checking for a sampling bias, as the reference sampling system is considered to be fully TOS-compliant, i.e. representative. This column forms a comprehensive backdrop for the on-line alternative of variographic characterisation of the same iron ore pellet stream (which will follow in the next instalment).
Introduction: status of current ISO standards
Primary sampling of iron ore is well established and standardised through the International Organization for Standardization (ISO). In comparison to standardisation of other mineral commodities and particulate materials (e.g. food/feed, pharmaceuticals), iron ore sampling standards are in close compliance with the Theory of Sampling (TOS).1–3 Iron ore mining and processing operations apply sampling and grade control in all parts of the production value chain, from diamond drill and blast holes all the way to process sampling of slurries, pellet feed, finished pellets and at ship loading. Sampling of iron ore is standardised through the international standard ISO 3082: “Iron ores—Sampling and sample preparation procedures”.4 The iron ore industry has improved its conformance to ISO 3082 over the last 10–20 years, especially regarding commercial purposes. However, there are still several areas where deviations from the standard and issues with sample representativity are common.3 For newly constructed sampling systems or in-use systems that have been modified, ISO 3082 demands verification of the full sampling system in accordance to ISO 3086: “Iron ores—Experimental methods for checking the bias of sampling”.5 We here report on an experimental verification and validation experiment, as a base-line reference to be compared with an on-line variographic sampling system QC in the following column.
Fundamental Sampling Principle and basic requirements for iron ore sampling systems
The Fundamental Sampling Principle (FSP) for representative sampling states that all parts of the lot must have equal probability of being selected for the sample.6–8 This principle is equally important for primary sampling extraction as for all subsequent sampling stages, i.e. during mass reduction/sample division. ISO 3082 describes the best place for primary sample extraction to be at a transfer point between conveyor belts, where a full cross-section of the stream can be intercepted, and extracted at regular intervals. Sampling from stationary lots such as ships or stockpiles is not permitted by ISO 3082, as it is impossible to drive a sampling device through the lot depth and extract a full column of ore. ISO 3082 therefore recommends only to extract samples as the ore is being transported to or from a ship, stockpile, bunker or silo.
The extraction of primary increments shall comply with the following regulations to ensure that no bias is generated (well-tested TOS principles):
- a complete cross-section of the ore stream shall be taken when sampling from a moving stream;
- the speed of the sample cutter shall not exceed 0.6 m s–1, unless the cutter aperture is correspondingly increased;
- the sample cutter shall travel through the ore stream at uniform speed, both the leading and trailing edges of the cutter clearing the ore stream at the end of its traverse;
- the lips on the sample cutter shall be parallel for straight-path samplers and radial for rotary cutters; these conditions shall be maintained as the cutter lips wear;
- changes in moisture content, dust loss and sample contamination shall be avoided;
- free-fall drops shall be kept to a minimum to reduce size degradation of the ore pellets and hence minimise bias in size distribution;
- primary cutters shall be located as near as possible to the loading or discharging point to further minimise the effects of size degradation;
- a complete column of ore with nominal top size less than 1 mm shall be extracted when sampling iron ore concentrate in a wagon.
Principles and general requirements for checking sampling bias
The method for checking for sampling bias is to compare the online stream sampling system (Figure 1) to a reference sampling method considered to produce true and unbiased results. For 1-D process sampling, the reference is the so-called “stopped belt” sampling using a sampling frame as outlined for manual increment/sample extraction, see Figure 2.
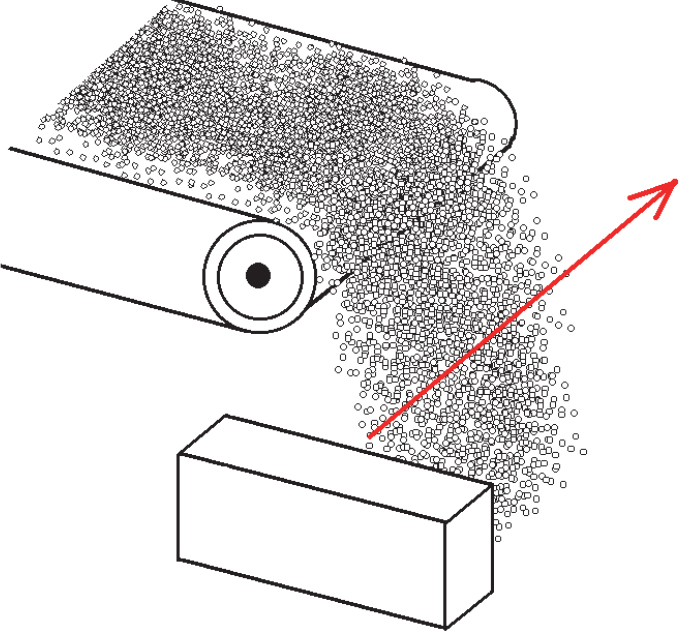
Figure 1. Illustration of the pinciple of the recommended cross-stream sampler. Image credit: ACABS research group.
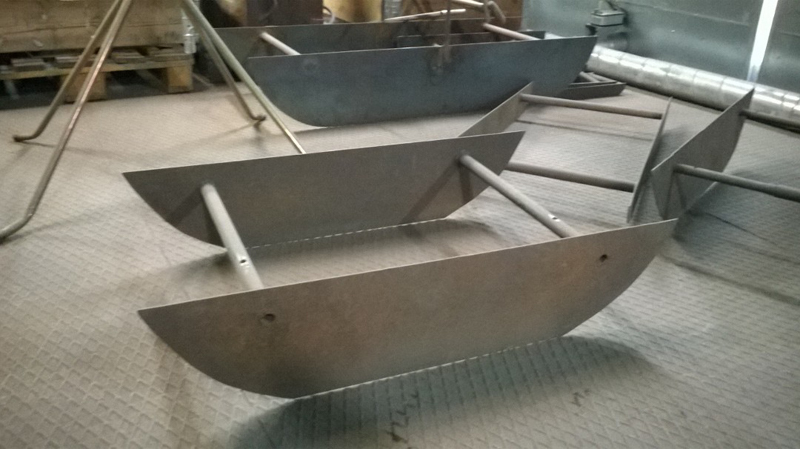
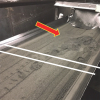
Figure 2. Example of a “stopped belt” sampling frame allowing a complete cross-section of the ore stream to be extracted. This will serve as a reference to the online sampling system (Figure 1). Image credit: LKAB.
The number of paired comparisons between the reference method (method A) and the sampling method to be tested (method B) should be no less than ten. The samples A and B should be taken as close together as possible to ensure that the local variability in the ore does not affect the bias test. Quality characteristics important to the ore, such as iron content, size distribution or other metallurgical, chemical or physical properties can be used for bias testing (ISO 3082). But it is well-known that size distribution parameters offer the most powerful check—if the size distribution of method A and B is identical, so will the chemistry.
The paired measurements for the selected quality characteristics are compared using a 90% confidence interval, or an equivalent t-test, for checking if there is a bias present for the B sampling system.
The current edition of both the ISO standard for checking of bias (ISO 3082) and the ISO standard for estimation of sampling precision (ISO 3085) support elimination of outliers identified through a Grubbs outlier test, taking no account whether assignable causes can be identified or not. This method of outlier eliminating is likely to affect the bias test by favouring the tested sampling system (B) as well as underestimating the sampling system precision. Later publications have recommended that identified outliers should only be eliminated after bona fide assignable causes have been identified; in addition, a new data set should also be collected and processed to ensure correct calculations.9 (N.B. these published suggestions are in the process of being incorporated in the upcoming revisions of the ISO standards for iron ore sampling.)
Validation experiment
The experimental validation reported here was executed at a sampling system collecting the final product from an iron ore pellet plant (i.e. process control samples—not commercial samples). The sampling system consists of a linear cross-stream sampler, Figure 1, collecting primary increments of iron ore pellets in accordance with the guidelines (ISO 3082). This system is based on a systematic time interval, collecting primary increments every five minutes. Apart from the primary sampling, the sampling system is fully automated with regard to sampling division, crushing for chemical analysis, sieving analysis, abrasion index analysis and crushing strength analysis.
In the present validation experiment, the primary sampling, sampling division and automated sieving analysis were validated. The schematics of the sampling system is presented in Figure 3. The ISO 3086 approach was used with the one exception that six (not ten) paired samples were extracted.
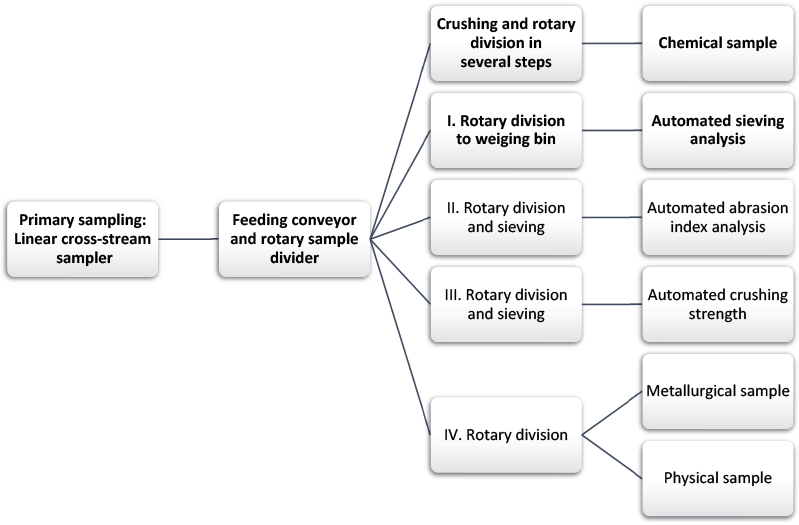
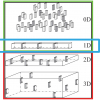
Figure 3. General schematics of complete automated sampling system, bold parts of the system were validated in the current study.
Experimental results
The validation results for the primary linear cross-stream sampler are presented in Table 1. The data were analysed using a two-sided t-test with a 95% confidence level. The t-test indicates that the primary sampler did not generate any bias for all parameters except for the particle size <5 mm, where a significant difference between the A and B sampling methods was identified: the linear cross-stream sampler overestimates the amount of fine material in the lot.
Table 1. Validation data for linear cross-stream sampler bias test.
| Fe | SiO2 | 12.5–16 mm | 10–12.5 mm | <5 mm |
Mean: linear cross stream samples | 66.69% | 2.143% | 12.5% | 59.6% | 2.0% |
Mean: stopped belt samples | 66.70% | 2.135% | 12.6% | 59.4% | 1.2% |
Mean difference | –0.01% | 0.008% | –0.1% | 0.2% | 0.8% |
Standard deviation for mean difference | 0.043% | 0.026% | 1.6% | 1.8% | 0.4% |
Critical t-value | 2.57 | 2.57 | 2.57 | 2.57 | 2.57 |
Statistical t-value | –0.67 | 0.71 | 0.13 | –0.32 | –5.0 |
Significant difference? | No | No | No | No | Yes |
The reason for this discrepancy was investigated by thorough inspection of the complete sampling system, leading to the conclusion that the problem was not related to increment extraction, but rather due to dust accumulation on the conveyor belt during transportation of the primary increments to the first rotary sample divider. This problem was counteracted by improving ventilation to decrease the amount of “ambient dust” in the environment around the primary sampler, and by improving the physical shielding of the conveyor, ensuring no dust can reach the belt from outside sources.
To ensure TOS-correctness (un-biasness) of the automated sieve analysis connected to the primary sampling system, a bias test was also conducted in relation to a well-controlled reference laboratory sieving setup. The results of the t-test for the six compared samples are presented in Table 2. The t-test does not show any statistical difference between the two pieces of sieving equipment and the validation of the automated sieve is therefore approved.
Table 2. Validation data for the automated sieve analysis sampler.
| 12.5–16 mm | 9–12.5 mm | 5–9 mm |
Mean: automated sieve | 18.7% | 74. 9% | 3.5% |
Mean: reference sieve | 18.5% | 75.2% | 3.9% |
Mean difference | 0.2% | –0.3% | –0.4% |
Standard deviation for mean difference | 4.7% | 3.9% | 0.9% |
Critical t-value | 2.57 | 2.57 | 2.57 |
Statistical t-value | 0.09 | –0.19 | –1.07 |
Significant difference? | No | No | No |
Discussion
The result from the validation experiment of the primary linear cross-stream sampler illustrates the critical importance of validation experiments and bias testing. Even though the sampling system was constructed according to TOS principles and ISO 3082, a bias could be detected due to sample contamination after primary sample extraction, revealing an Incorrect Preparation Error (IPE) effect.
The decision to decrease the number of paired samples from ten to six in this validation experiment was due to cost considerations at the discretion of LKAB. Thus, the experiment had the possibility to be extended with four additional paired samples if the results were inconclusive.
Even though a base-line validation of all new or modified sampling systems is required (ISO 3082), continuous monitoring and control is also mandatory—to ensure continuous representative sampling and analytical results.
Apart from regular maintenance and visual inspection, continuous variographic characterisation is an efficient way of monitoring and quality grading process sampling systems over time, ensuring that significant deviations in sampling or analytical variability has accidentally been introduced. The variographic approach is well described in previous columns, and will be applied to the same parameters used here to show how the present iron sampling procedure also can be monitored on-line (in a following column).
References
- P. Gy, “Sampling of discrete materials—a new introduction to the theory of sampling I. Qualitative approach”, Chemometr. Intell. Lab. Syst. 74, 7–24 (2004). doi: https://doi.org/10.1016/S0169-7439(04)00167-4
- R.J. Holmes and G.J. Robinson, “Codifying the principles of sampling into minerals standards”, Chemometr. Intell. Lab. Syst. 74, 231–236 (2004). doi: https://doi.org/10.1016/j.chemolab.2004.03.011
- R.J. Holmes, “Common pitfalls in sampling iron ore”, Proceedings 8th World Conference on Sampling and Blending, 9–11 May, Perth, Australia, pp. 261–264 (2017).
- International Organization for Standardization, ISO 3082: Iron Ores—Sampling and Sample Preparation Procedures (2009).
- International Organization for Standardization, ISO 3086: Iron Ores—Experimental Methods for Checking the Bias of Sampling (2006).
- P. Gy, Sampling of Particulate Materials—Theory and Practice, 2nd Edn. Elsevier, Amsterdam (1979).
- F.F. Pitard, Pierre Gy’s Sampling Theory and Sampling Practice, 2nd Edn. CRC Press Inc., Florida (1993).
- J.E. Everett, T.J. Howard and B.J. Beven, “Precision analysis of iron ore sampling preparation and measurement overcoming deficiencies in current standard ISO 3085”, Min. Technol. 120, 65–73 (2011). doi: https://doi.org/10.1179/1743286311Y.0000000002
- K.H. Esbensen (Chairman Taskforce F-205 2010–2013), DS 3077. Representative Sampling—Horizontal Standard. Danish Standards (2013). http://www.ds.dk