Mohamed Mokhtar,* Tamer Wafy and Mahmoud Abdelhafiz
Chemical Engineering Department, Military Technical College, Cairo, Egypt
DOI: https://doi.org/10.1255/sew.2021.a23
© 2021 The Authors
Published under a Creative Commons BY-NC-ND licence
Raman spectroscopy is an important technique for explosive detection. However, the output spectra are sometimes ambiguous and not strong enough to be analysed. In this work, Surface-Enhanced Raman spectroscopy (SERS) for energetic materials detection was achieved by using in situ impregnated silver nanoparticles in the membrane substrate. The substrates used in SERS were characterised by ultraviolet-visible (UV-vis) spectroscopy and scanning electron microscopy (SEM) with energy dispersive spectroscopy (EDS) for elemental analysis. Three substrates were used, all of which were impregnated with silver-nanoparticles. The first substrate (A) received no coating, while the other two substrates (B and C) were coated on one side only with a polymer epoxy layer with a thickness of 0.01 mm and 1 mm, respectively. The three different substrates were used for the detection of an energetic material, TNT, by Raman spectroscopy. The Raman spectrum of TNT using the impregnated substrate without any coating (A) showed an enhancement in the results compared to the epoxy-coated substrates (B and C). Hence, substrate A can be used for energetic materials detection.
Introduction
Nowadays, with terrorism attacks around the World, researchers are looking at ways to reduce both civilian and military casualties. Early detection of dangerous materials, especially explosives, is one of the main ways in which terrorism operations can be aborted.1 Fast, practical and accurate detection techniques are in high demand to counter these attacks. Such techniques should produce results that have high sensitivity together with ease and simplicity of use so that they can be deployed in the field. However, it has been found that accurate detection of explosives is challenging. Further, the presence of traces of explosive in water is a serious problem as it affects directly both living aquatic species and humans.2 Various analytical techniques have been used to help to identify the explosophorous groups. Chromatographic and spectrometric techniques are the basic methodologies that have been used for what are risky tasks.3,4 However, relatively expensive techniques such as mass spectrometry and Fourier transform infrared (FT-IR) spectroscopy need special sample preparation and long processing steps to be able to complete the required analysis, which makes them unsuitable for use in the field. In addition, traces of explosive are barely detectable by conventional or even by advanced instruments of these types.
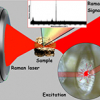
Raman spectroscopy has an advantage over these instruments through on-site detection of sample traces without special sampling treatment.5,6 In addition, Raman spectroscopy does not need samples to be in solution, which enables it to be utilised in diverse environments. Raman spectroscopy records a unique spectrum that helps to accurately identify the investigated sample.7–10 The mechanism of the Raman spectroscopy detection process is that the incident beam from the Raman laser source interacts with the molecules of the investigated sample causing different vibration modes. The reflected radiation from the sample molecules is detected and appears as a characteristic spectrum which is specific to the tested sample.11 Raman spectroscopy is important in the explosive detection field.12 However, sometimes, the Raman spectrum of an explosive may be ambiguous due to the absence or weakness of some fundamental peaks used for sample recognition.
Researchers have attempted to improve the Raman spectrum using a variety of techniques to enhance these weak peaks so that they can be easily analysed. It has been found that nanoparticles, especially metallic ones such as silver (Ag) and gold (Au), show a plasmon resonance when subjected to a Raman laser source: the incident beam strikes the metal nanoparticles causing excitation of these particles. When these excited nanoparticles return back to their relaxation mode, the emitted radiation frequency can build a magnetic field within the spot of the incident beam.13,14 The sample to be tested is placed on these nanoparticles and the reflected beam from the sample molecules is magnified due to the adjacent magnetic field created from the interaction between the incident light beam and the nanoparticles.15
2,4,6-Trinitrotoluene (TNT) is a very common explosive which has been involved in the production of land and sea mines, as well as terrorist bombs. TNT is easily absorbed by both skin and soil, and is classified as a carcinogenic material with high toxicity and long-term negative impacts. For these reasons, several researchers have been attracted to investigate the detection of traces of TNT. These attempts were based on the preparation of various substrates impregnated with metallic nanoparticles using the chemical vapour deposition16 or spin coating techniques.17 However, all these investigations were based on two-step methodologies involving the preparation of a suspended solution of the explosive traces prior to use of the detection techniques.18–20
In this study, a simple, more practical and straightforward one-step method was successfully utilised. The explosive detection technique is based upon the simple preparation of a substrate (commercial filter paper) impregnated with Ag-nanoparticles produced through a one-step in situ reduction of silver nitrate using ascorbic acid as a suitable reducing agent. Further treatment after washing and drying to remove unreacted reagents and impurities took place by applying a layer of elastomeric polymer to the substrate surface to improve the capture of sample traces on the substrate.
Material and methods
Materials
L-Ascorbic acid from BDH Chemical, Poole, UK, and silver nitrate crystals [general purpose reagent (GPR) A’ grade] from Hopkin & Williams were used. Whatman Number 1 filter paper and diglycidyl ether of bis Phenol A (DGEBA) of EEW 500 epoxy and polyamide as a hardener were purchased from ISPAC. The energetic material, TNT, was prepared in our local laboratory.
Substrate preparation
3 g of silver nitrate was dissolved in 100 mL distilled water under suitable agitation. The substrate was immersed in this solution for 12 h to guarantee the complete saturation of the filter paper. The ascorbic acid solution, as a reducing agent, was prepared by dissolving 1 g of ascorbic acid in 50 mL distilled water (Figure 1). The prepared reducing agent solution was applied to the saturated filter paper with silver nitrate solution by spraying to ensure in situ reduction of the silver nitrate and the production of silver particles. Then, the treated substrate was put in an oven at 60° C for 6 h to evaporate the water solvent. After drying the substrate, the sample was washed with distilled water and dried again.
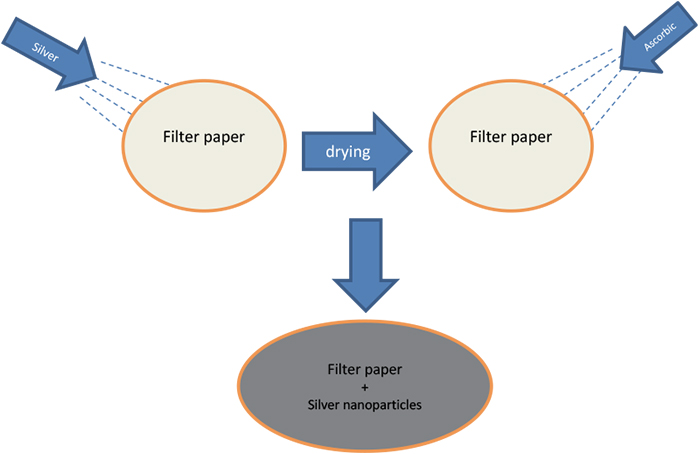
Figure 1. Preparation of SERS substrates.
This cycle of washing and drying the sample was repeated three times to ensure removal of reactant residuals and unattached products. The elastomeric polymer was prepared by mixing the epoxy DGEBA with polyamide in the ratio of 1 : 0.45 and adding a suitable solvent, such as xylene, to the mixture in the ratio of 0.1 : 1. Three substrates were used for SERS; all of them were impregnated with Ag-nanoparticles. Two of them were then coated: substrate B was coated with a 0.01 mm epoxy layer and substrate C was coated with a 1 mm epoxy layer, while the third substrate, A, was left uncoated.
UV-vis spectroscopy
UV-vis spectroscopy over the range of 200–800 nm was conducted for the prepared Ag-nanoparticles (Figure 2). The previous procedure for Ag-nanoparticle preparation on a substrate was followed except that we did not use a substrate and the reduction reaction took place in a glass test tube. The resulting suspended silver nanoparticles were diluted for analysis using a UV-vis spectrometer (Shimadzu UV-1700).
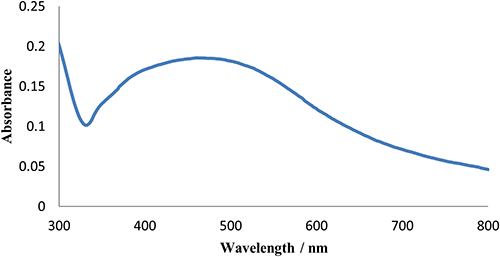
Figure 2. UV-vis spectrum of Ag-nanoparticles sample.
Scanning electron microscopy with energy dispersive X-ray spectroscopy
The prepared samples were subjected to scanning electron microscopy (SEM) (Zeiss EVO 10 equipped with a Bruker EDS) to investigate the silver particles’ size, size distribution among the substrate, and the surface morphology of the applied epoxy and its homogeneity distribution along the substrate surface. Cross-sectional SEM images were collected to study the silver particles’ distribution by substrate depth. Energy dispersive spectroscopy (EDS) for elemental analysis was conducted to confirm the nature of the Ag-nanoparticles on the substrate.
SERS for explosive detection
Raman spectroscopic measurements were carried out on a solid sample of TNT using a dispersive Raman microscope (Senterra II, Bruker, Germany). Raman spectra were collected continuously with spectral resolution of 4 cm–1. A Nikon 20× objective was used to focus the Raman excitation sources (2.5 mW at 532 nm and 100 mW at 785 nm, neodymium-doped yttrium aluminium garnet (Nd:YAG) laser, Bruker, Germany). Spatial resolution was in the order of 1 µm for the 20× objective lens and 361 nm for the 100× objective lens. Several points on the substrates were used in the SERS measurement methodology as shown in Figures 3 and 4. Data collection time was 1000 ms (co-addition of three spectra), the illumination area was 50 × 50 µm, fluorescence baseline correction was performed using a third-order polynomial, followed by the application of a three-point moving average filter to eliminate most of the perturbing baseline and improve the signal-to-noise ratio.
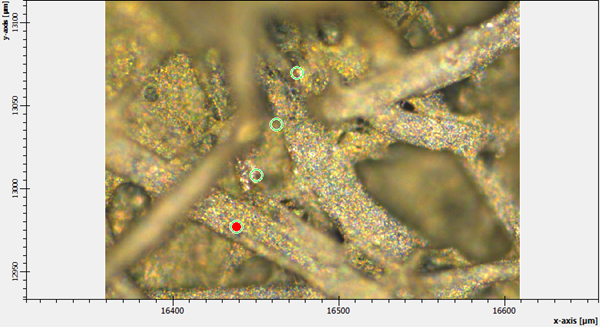
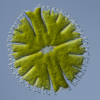
Figure 3. Several selected points for Raman analysis of pure Ag-nanoparticles on substrate.
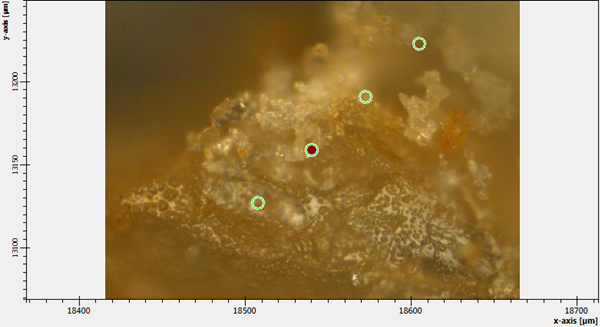
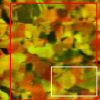
Figure 4. Several selected points for Raman analysis of Raman spectrum of TNT + Ag-nanoparticles on substrate at 785 nm.
First, the explosive sample was placed as solid powder in a quartz cuvette and subjected to Raman spectroscopy to collect the Raman spectrum of the explosive sample as a reference. Then we measured the prepared membrane substrate by Raman spectroscopy without any explosive samples to produce a Raman zero background (so we could subtract the Raman spectrum of the substrate from the analysis of the real samples). 0.01 mg of the explosive powder was put on the membrane substrate and then subjected to Raman spectroscopy for detection.
Results and discussion
UV-vis spectroscopy
UV-vis spectra of the prepared Ag-nanoparticles in the spectral range 200–800 nm showed a peak at 484 nm. The peak is broad and according to Mie’s observations, could be attributed to the irregular shape and polydispersity of the sample.21
SERS for explosive detection
TNT on substrate A showed no results when using the laser source at 532 nm with different powers. Figure 5 shows the Raman spectrum of TNT explosive alone and the enhanced Raman spectrum of TNT + substrate A using a laser source of 785 nm and a power of 100 mW. Several experiments were conducted to reach this power as the minimum required to get a good spectrum for TNT. Different peaks were seen in the range between 1700 cm–1 and 100 cm–1. Peaks at 1616 cm–1 and 1532 cm–1 are attributed to strong vibration of the C=C π bond in an aromatic ring chain—the benzene ring in the case of TNT22—or are attributed to an asymmetric vibration of the 2,6-NO2 bond and an asymmetric vibration of the –NO2 bond in the benzene ring.23 The peak at 1358 cm–1 is due to to a strong symmetric vibration of the C–NO2 bond as the nitrate groups attached to the benzene ring in the TNT structure.24 Peaks at 823 cm–1 and 792 cm–1 are due to the scissoring vibration mode of the C–NO2 bond and the stretching vibration mode for C–CH3. For the SERS of TNT using substrate A, it was noticed that new, interesting peaks appeared for the first time in the Raman spectrum; such as the peak at 2956 cm–1, which is related to the strong vibration of the C–H bond, and the peak at 3098 cm–1, due to the strong vibration of the =C–H bond in an aromatic structure such as a benzene ring. Moreover, the intensity of the peaks, from comparing the half-height width of the peaks, increased by approximately seven times. This enhancement effect could be attributed to the plasmon resonance of the distributed Ag-nanoparticles on the substrate.
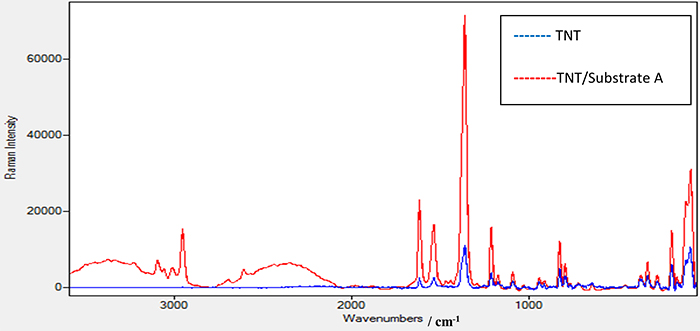
Figure 5. Raman spectrum for TNT sample alone and TNT sample on the prepared substrate A using a laser source at 785 nm and power of 100 mW.
Figure 6 shows the Raman spectrum of TNT using the laser source at 532 nm with power of 2.5 mW. The same peak positions appeared as in the TNT Raman spectrum using the 785 nm laser source. In addition, a new peak at 2956 cm–1 appeared which is attributed to the strong vibration of the C–H bond in the TNT structure. A further peak at 3098 cm–1 is due to the strong vibration of the =C–H bond. An observation to note is that when comparing the Raman spectra of TNT using 532 nm and 785 nm lasers and the enhanced Raman spectrum of TNT using substrate A as shown in Figure 7, the methods all share the same peak positions except those at 2956.50 cm–1 and at 3098 cm–1 with the 532 nm laser which do not appear with the 785 nm laser. This means that these peaks are characteristic of TNT and only appear using a high-energy laser source such as 532 nm. This is a good verification that substrate A significantly enhances the peak at 2956 cm–1 when we use a Raman spectrometer with a low-energy laser source at 785 nm. The same procedure was conducted for TNT on the coated substrates B and C. Substrate C, with a thick film of elastomer, was excluded as it gives a poor signal-to-noise ratio. On the other hand, no results were seen when using the 785 nm laser with different powers for TNT on substrate B. However, substrate B—TNT coated with a thin film of elastomer—gave clear results when the 532 nm laser source with 2.5 mW power was used. The decrease in the intensity of the scattered light is due to the presence of this thin elastomer film which absorbs some of the scattered light which consequentially affects its intensity.
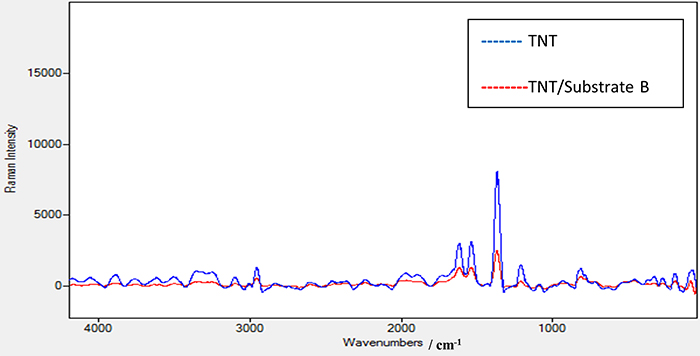
Figure 6. Raman spectrum for TNT sample alone and Raman spectrum for TNT sample on the prepared substrate B using a laser source at 532 nm and power of 2.5 mW.
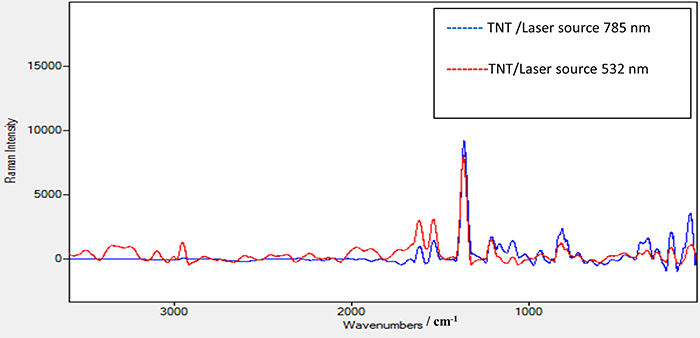
Figure 7. Raman spectrum for TNT sample alone using a laser source of 532 nm and power of 2.5 mW and TNT sample alone using laser source 785 nm and power 100 mW.
SEM-EDS
Figure 8 shows that substrate A is doped with well-distributed Ag-nanoparticles of different nano sizes. At high magnification (39 k×), it is observed that the Ag-nanoparticles are in the size range 130–250 nm and are distributed evenly through the substrate.
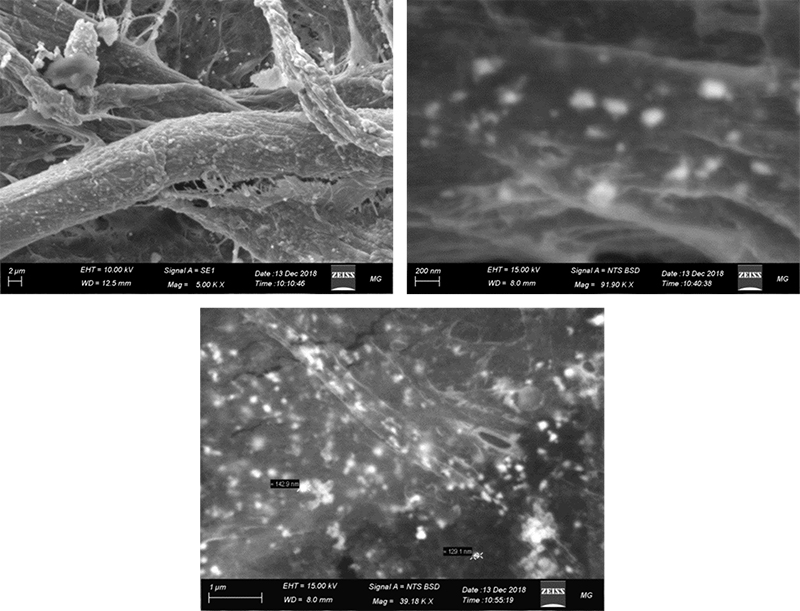
Figure 8. SEM spectroscopy of substrate A (Ag-nanoparticles on filter paper substrate).
From the EDS analysis, as shown in the elemental analysis graph in Figure 9 and the element distribution pattern in Figure 10, it can be seen that the sample had 17.03 % mass of C, 6.48 % mass of O, 0.22 % mass of Si, 1.15 % mass of S and 38.71 % mass of Ag. This indicates that the Ag-nanoparticles are present in greater mass in substrate A, which we propose is suitable as a substrate for Raman enhancement proposes.
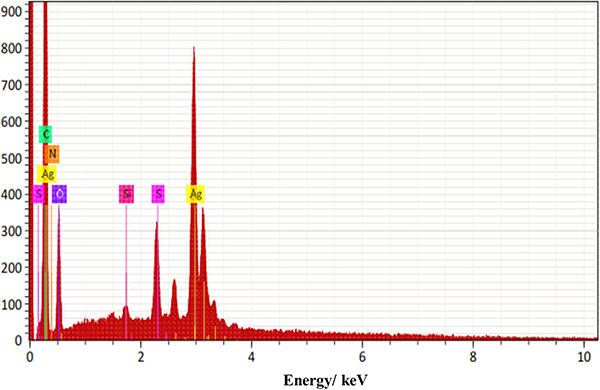
Figure 9. EDS elemental analysis for substrate A.
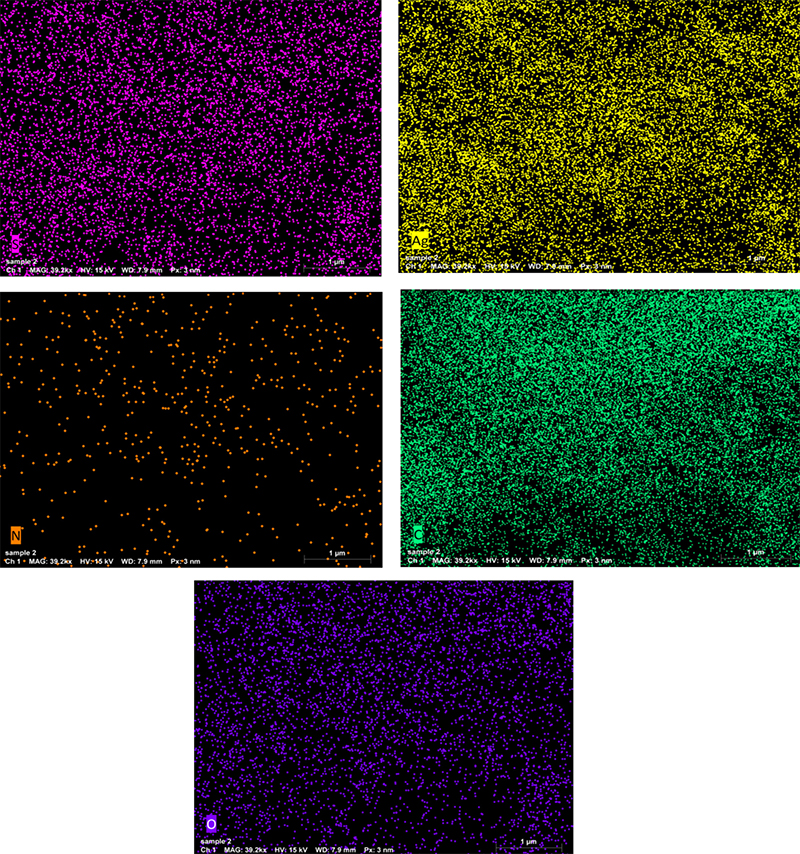
Figure 10. EDS elemental distribution pattern of substrate A.
Conclusions
In this study, a simple, more practical and straightforward one-step method was successfully utilised for the detection of TNT explosive traces in their naturally solid form. Herein, in situ deposition of Ag solid nanoparticles upon a commercial filter paper, as the substrate, occurred directly instead of the preparation of a suspended solution as in most of the previous works in the literature. Interestingly, new characteristic peaks for TNT appeared either at high-energy (583 nm) or at low-energy laser source (785 nm). This could be considered as an improvement in the detection technique of solid particles of TNT using a simple one-step method. Adding a polymeric layer on the substrate by coating it with the elastomer DGEBA made the substrate more flexible and sticky for sample capture purposes. However, applying the polymer to the impregnated substrate destroys its capability for Raman enhancement. Substrate A shows a good Raman enhancement of the tested sample TNT. Substrate C showed unexpected failure in Raman spectrum enhancement due to the thick layer of the polymer coat. Substrate B with the applied thin layer of the elastomer is sticky enough to hold the traces of the tested sample. However, it showed no difference in Raman enhancement for the tested explosive sample of TNT, so it is not suitable for explosive detection. Substrate A is suitable for explosive detection using the Raman enhancement technique, and in the future work on different explosives will be carried out with this substrate.
Author contributions
The manuscript was written through contributions of all authors. All authors have given approval to the final version of the manuscript.
CRediT authorship contribution statement
Mohamed Mokhtar, Tamer Wafy and Mahmoud Abdelhafiz supervised/co-ordinated the whole work and were involved in funding acquisition, project administration, experimental work, measurement and data treatment, writing/reviewing the text and conceptualisation and proposing the main idea.
Declaration of competing interests
The authors declare that they have no known competing financial interests or personal relationships that could have appeared to influence the work reported in this paper.
References
- W.O. Rivera, Standoff Raman Spectroscopy System for Detection of Explosives, Chemical Warfare Agents Simulants and Toxic Industrial Compounds. University of Puerto Rico, Mayaguez, Puerto Rico (2008). https://hdl.handle.net/20.500.11801/444
- O.A. Sadik, A.K. Wanekaya and S. Andreescu, “Advances in analytical technologies for environmental protection and public safety”, J. Environ. Monitor. 6, 513–522 (2004). https://doi.org/10.1039/b401794n
- A. Eshkeiti, B. Narakathu and A. Reddy, “A novel fully gravure printed flexible surface enhanced Raman spectroscopy (SERS) substrate for the detection of toxic heavy metals”, 14th International Meeting on Chemical Sensors - IMCS 2012, Ch. P2.3 Sensors Based on Optical Techniques (2012). https://doi.org/10.5162/IMCS2012/P2.3.11
- N. Zhang, L. Tong and J. Zhang, “Graphene-based enhanced Raman scattering toward analytical applications”, Chem. Mater. 28(18), 6426–6435 (2016). https://doi.org/10.1021/acs.chemmater.6b02925
- S.N. Chen, X. Li, S. Han, J.H. Liu and Y.Y. Zhao, “Synthesis of surface-imprinted Ag nanoplates for detecting organic pollutants in water environments based on surface enhanced Raman scattering”, RSC Adv. 5, 99914–99919 (2015). https://doi.org/10.1039/C5RA19528D
- S. Sadate, C.F. Iii, A. Kassu and A. Sharma, “Standoff Raman spectroscopy of explosive nitrates using 785 nm laser”, Am. J. Remote Sens. 3(1), 1–5 (2015). https://doi.org/10.11648/j.ajrs.20150301.11
- R.S. Das and Y.K. Agrawal, “Raman spectroscopy: recent advancements, techniques and applications”, Vibr. Spectrosc. 57(2), 163–176 (2011). https://doi.org/10.1016/j.vibspec.2011.08.003
- E.L. Izake, “Forensic and homeland security applications of modern portable Raman spectroscopy”, Forensic Sci. Int. 202(1–3), 1–8 (2010). https://doi.org/10.1016/j.forsciint.2010.03.020
- J.R. Baena and B. Lendl, “Raman spectroscopy in chemical bioanalysis”, Curr. Opin. Chem. Biol. 8(5), 534–539 (2004). https://doi.org/10.1016/j.cbpa.2004.08.014
- J.Jehlička, P. Víteka, H.G.M. Edwards, M. Heagraves and T. Čapoun, “Application of portable Raman instruments for fast and non-destructive detection of minerals on outcrops”, Spectrochim. Acta A 73(3), 410–419 (2009). https://doi.org/10.1016/j.saa.2008.09.004
- A. Eshkeiti, Fabrication of Printed Substrate for Surface Enhanced Raman Spectroscopy. Master’s Thesis, Western Michigan University (2012). https://scholarworks.wmich.edu/masters_theses/25/
- C.M. Wynn, S. Palmacci, R.R. Kunz and M. Rothschild, “A novel method for remotely detecting trace explosives”, Lincoln Lab. J. 17(2), 1 (2008). https://www.ll.mit.edu/about/lincoln-laboratory-publications/lincoln-laboratory-journal/lincoln-laboratory-journal-8
- L. Dolgov, D. Pidhirnyi, G. Dovbeshko, T. Lebedieva, V. Kiisk, S. Heinsalu, S. Lange, R. Jaaniso and I. Sildos, “Graphene-enhanced Raman scattering from the adenine molecules”, Nanoscale Res. Lett. 11, 197 (2016). https://doi.org/10.1186/s11671-016-1418-5
- Y. Song, “Molecular selectivity of graphene-enhanced Raman scattering”, Nano Lett. 15(5), 2892–2901 (2015). https://doi.org/10.1021/nl5045988
- G. Herrera, A. Padilla and S. Hernandez-Rivera, “Surface enhanced Raman scattering (SERS) studies of gold and silver nanoparticles prepared by laser ablation”, Nanomaterials 3(1), 158–172 (2013). https://doi.org/10.3390/nano3010158
- W. Xu, X. Ling, J. Xiao, M.S. Dresselhaus, J. Kong, H. Xu, Z. Liu and J. Zhang, “Surface enhanced Raman spectroscopy on a flat graphene surface”, Proc. Natl. Acad. Sci. USA 109(24), 9281–9286 (2012). https://doi.org/10.1073/pnas.1205478109
- K. Mondal, J. Kumar and A. Sharma, “TiO2-nanoparticles-impregnated photocatalytic macroporous carbon films by spin coating”, Nanomater. Energ. 2(3), 121–133 (2013). https://doi.org/10.1680/nme.12.00034
- E.L. Holthoff, D.N. Stratis-Cullum and M.E. Hankus, “A nanosensor for TNT detection based on molecularly imprinted polymers and surface enhanced Raman scattering”, Sensors 11(3), 2700–2714 (2011). https://doi.org/10.3390/s110302700
- J.R. Lombardi and R.L. Birke, “A unified approach to surface-enhanced Raman spectroscopy”, J. Phys. Chem. C 112(14), 5605–5617 (2008). https://doi.org/10.1021/jp800167v
- L. Yang, L. Ma, G. Chen, J. Liu and Z.-Q. Tian, “Ultrasensitive SERS detection of TNT by imprinting molecular recognition using a new type of stable substrate”, Chem. Eur. J. 16(42), 12,683–12,693 (2010). https://doi.org/10.1002/chem.201001053
- K.-A. Kim, J.-R. Cha, S.-W. Yun and M.-S. Gong, Bull. Korean Chem. Soc. 36(5), 1426–1432 (2015). https://doi.org/10.1002/bkcs.10281
- Y. Liu, R. Perkins, Y. Liu and N. Tzeng, “Normal mode and experimental analysis of TNT Raman spectrum”, J. Mol. Struct. 1133, 217–225 (2017). https://doi.org/10.1016/j.molstruc.2016.12.015
- K. Andersson, Masters Thesis. Umea University (2010).
- R. Chirico, S. Almaviva, F. Colao, L. Fiorani, M. Nuvoli, W. Schweikert, F. Schnürer, L. Cassioli, S. Grossi, D. Murra, I. Menicucci, F. Angelini and A. Palucci, “Proximal detection of traces of energetic materials with an eye-safe UV Raman prototype developed for civil applications”, Sensors 16(1), 8 (2015). https://doi.org/10.3390/s16010008

Mohamed Mokhtar
Mohamed Mokhtar had obtained his BSc and MSc (Chemical Engineering) from the Military Technical College, Cairo, Egypt in 2001 and 2008, respectively, and a PhD in ion selective membranes from McMaster University, Canada. He currently works as a lecturer in the Chemical Engineering department of the Military Technical College. His main areas of research include synthesis, characterisation and applications of nano-sized particles, MOFs, synthesis and characterisation of selective membranes, water and wastewater treatment, developing of energetic materials, analysis and detection of energetic materials. 0000-0003-3138-5460
[email protected]

Tamer Wafy
Tamer Z. Wafy graduated from the Chemical Engineering branch of the Military Technical College (MTC), Egypt in 1997, and obtained a Master of Science (MSc.Eng) in composite propellants there in 2003. He received his doctor of philosophy (PhD) in nanostructured materials from The University of Manchester in 2013. He joined the Chemical Engineering Branch of the MTC in 1998 initially as Teaching Assistant, then Assistant Lecturer, Lecturer and Associate Professor.
His research is mainly in nanostructured materials specialising in nanocarbons and their applications. His interests are in aspects of the relationships between structure and mechanical properties of polymers and energetic composites, and he has published more than 15 papers in the field. This is now the main activity of his research which investigates the application of Raman spectroscopy to monitor deformation processes in carbon nanotubes and composites and in explosives detection, and standoff detection of explosives. Also he is focusing on developing scalable processes to synthesise a variety of nanomaterials with well-defined atomic structures, assemble these nanomaterials into functional macroscale structures, and use these novel materials for explosives detection, ballistic protection and environmental applications.
[email protected]

Mahmoud Abdelhafiz
Mahmoud Abdelhafiz obtained his BSc and MSc (Chemical Engineering) from the Military Technical College, Cairo, Egypt in 1997 and 2003, respectively. He was granted The Egyptian State Award in 2003 for being in first place among my whole patch. He obtained a PhD degree in nanotechnology applications from the Chemical and Biological Engineering Department, University of Sheffield, UK. He is currently working as a Teacher Assistant in the Explosives and Rocket Propellants department, Chemical Engineering Branch, Military Technical College. His main areas of research include synthesis, characterisation and applications of nano-sized particles, electrospinning technology, synthesis and characterisation of high-energy materials, development of insensitive ammunition and high-performance plastic explosives, Investigation of modern gun and rocket propellants, ageing and life extension of propellants. 0000-0001-7482-5695
[email protected]