
Spectroscopy Applications
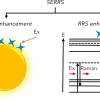
Surface-enhanced resonance Raman scattering is a technique that offers unparalleled sensitivity and specificity in non-destructive spectroscopic detection. It is a combination of surface-enhanced Raman scattering and resonance Raman spectroscopy.
The work shown in this paper suggests that Raman based spectrometers enabled by the High-Throughput Virtual Slit can be useful for in situ real time verification of the inclusion complex formation.
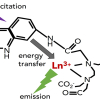
Luminescent optical probes based on lanthanide chelates have attracted particular attention over the last decades in the biomedical field due to their versatile magnetic and photoluminescent properties.
Substantial improvement in the detection efficiency of Na and Mg in milk formula can be made when using a silicon drift detector with a graphene window.

This application note describes detection of trace amounts of potassium ferrocyanate in table salt.
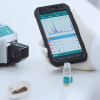
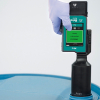
This application note describes the use of the Metrohm Instant SERS Analyzer to provide quick, easy and robust detection of melamine in a complex food matrix.
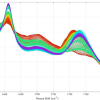
This application note compares intelligent spectra eXTRaction Raman technology with conventional 785 nm and 1064 nm Raman devices for the analysis of chemicals that are difficult to measure due to their known fluorescent properties.

Tourmalines are well-known, valuable gemstones available in a variety of colours.

Hyperspectral imaging (HSI) is gaining wide acceptance as one of the most valuable optical tools for art archiving and restoration. As a non-invasive and non-destructive imaging technique, HSI is safe for even the most fragile samples.

An overview of the techniques and configurations used to build dynamic interferometers and measurement results for a variety of space-based optical components.
IR spectroscopy of aqueous samples can be challenging due to the strong absorbance of water, however, horizontal multibounce ATR gives sufficient sensitivity.

A hybrid system using holography and Raman spectroscopy offers promise for monitoring microplastics at depths where sea life outnumbers the plastics.
A method for the direct analysis of trace elements in seawater samples by ICP-MS, one of the most difficult matrices to analyse for the presence of heavy metals and other trace elements.
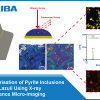
In this application note, pyrite impurities and major elements distribution in a commercial lapis lazuli pendant are studied.

ICP-MS is used to identify the presence of impurities in lithium battery materials.

A wide spectrum of elements in cell culture media samples were analysed with high accuracy and precision using PerkinElmer’s NexION® 5000 Multi-Quadrupole ICP-MS instrument.
The in situ characterisation of protein unfolding, including intermediate conformations is the holy grail for a host of biological questions.

The Pearl™ FT-IR transmission accessory is used to analyse milk to meet quality control standards.
The SC-41 fluorescence Plate Reader enables high-throughput measurements on the FS5 spectrofluorometer via automated measurements of microwell plates.

Raman spectroscopy is being used to distinguish between pure varieties and mixtures, and even identify the specific grape varietal.
