
John P. Hammond
Technical Manager, Starna Scientific Limited, 52–54 Fowler Road, Hainault, Essex IG6 3UT, UK
DOI: https://doi.org/10.1255/sew.2022.a13
© 2022 The Authors
Published under a Creative Commons BY-NC-ND licence
Introduction
In the last article,1 we concentrated on how the “screwdriver in the spectroscopist toolkit” the UV/visible spectro(photo)meter, and its associated software has evolved during our Four Generations. In this article we’ll now look at three other related spectroscopic techniques/tools in the box, namely, Fluorescence, near infrared (NIR) and Raman; and discuss the “what”, “where” and “how” of these techniques are being used to improve the quality of the measurement processes associated with them.
This article, therefore, uses the Four Generations in the previously described time periods and does uncover some interesting points for discussion. This chronology effectively plots the evolution of these techniques from Research to Analytical Quality Assurance (QA), and the associated Quality requirements associated with them.
However, with due deference to the multitude of reference texts available, let’s quickly state that it is not the intention of this article to discuss the theory of the appropriate science, and if this is of interest to the reader, then any of the excellent, and well-known texts, some of which are referenced below, should be consulted.
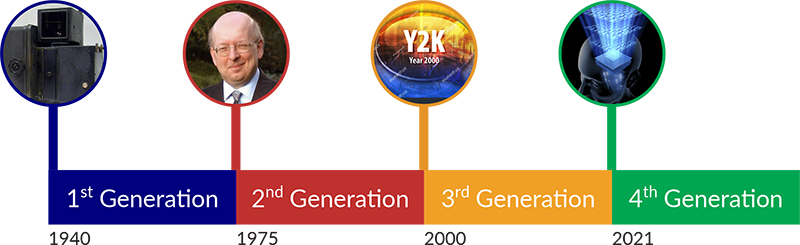
1st Generation: the years before 1975
During this period, the essential theory was established, and in some cases, instrumentation developed in a purely research orientated environment. However, unlike their UV/visible counterpart(s), the instrumentation that today populates our laboratories, and, as we shall see, increasingly other technical arenas will rely on later developments. For example, improvements in the quality and/or size of fundamental components, data processing etc. and these innovations will be discussed as appropriate in the chronology.
Fluorescence
In the 1950s the US National Institutes of Health’s Dr Robert Bowman developed a spectrophotofluorometer, or “SPF”, that allowed scientists to use fluorescence to identify and measure tiny amounts of substances in the body. Those familiar with the application of fluorescence will recognise the name, particularly as it is found in the Aminco–Bowman name of US-manufactured Series 2 (AB2) systems, referenced as the measurement instrument in many of the scientific papers of the period.
NIR
The near infrared (NIR) spectral region lies between 780 nm and 2500 nm (4000 cm–1 to 12,800 cm–1) bridging the more well-known and analytically used regions of the UV-Vis (190–780 nm) and the infrared (4000–600 cm–1). Until relatively recently, it has been called the “forgotten” region.
Vibrational spectroscopy in the NIR region is dominated by overtones and combinations that are much weaker than the fundamental mid-IR vibrations from which they originate. Because molar absorptivities in the NIR range are low, radiation can penetrate several millimetres into materials, including solids, and it is this capability that has allowed the development of many recent applications. Many materials, such as glass, are relatively transparent in this region. Fibre-optic technology is readily implemented in the NIR range, which allows monitoring of processes in environments that might otherwise be inaccessible.
The most common measurements performed in the NIR spectral range are transmission and reflection spectrometry. Incident NIR radiation is absorbed or scattered by the sample and is measured as transmittance, T, or reflectance, R, respectively. Transflection spectrometry is a hybrid of transmission and reflection wherein a reflector is placed behind the sample so that the optical path through the sample and back to the detector is doubled compared to a transmission measurement of a sample of the same thickness. Transflection is used to describe any double-pass transmission technique. The light may be reflected from a diffuse or specular (mirror) reflector placed behind the sample. This configuration can be adapted to share instrument geometry with certain reflection or fibre-optic probe systems in which the source and the detector are on the same side of the sample.
As mentioned in the last article,1 the Cary Model 14 UV-VIS Spectrophotometer was a double beam recording spectrophotometer designed to operate over the wide spectral range of ultraviolet, visible and near infrared wavelengths (UV/Vis/NIR). This included wavelengths ranging from 185 nm to 870 nm, and the Cary Model 14B, almost identical in exterior appearance, measured wavelengths from 0.5 nm to 6.0 µm.
Raman
Although the inelastic scattering of light was predicted by Adolf Smekal in 1923, it was not observed in practice until 1928. The Raman effect was named after one of its discoverers, the Indian scientist C.V. Raman, who observed the effect in organic liquids in 1928 together with K.S. Krishnan, and independently by Grigory Landsberg and Leonid Mandelstam in inorganic crystals. Raman won the Nobel Prize in Physics in 1930 for this discovery. Systematic pioneering theory of the Raman effect was developed by Czechoslovak physicist George Placzek between 1930 and 1934. The mercury arc became the principal light source, first with photographic detection and then with spectrophotometric detection.
In the years following its discovery, Raman spectroscopy was used to provide the first catalogue of molecular vibrational frequencies. Typically, the sample was held in a long tube and illuminated along its length with a beam of filtered monochromatic light generated by a gas discharge lamp. The photons that were scattered by the sample were collected through an optical flat at the end of the tube. To maximise the sensitivity, the sample was highly concentrated (1 M or more) and relatively large volumes (5 mL or more) were used.
Modern Raman spectroscopy nearly always involves the use of lasers as excitation light sources; however, lasers were not available until more than three decades after the discovery of the effect, the first laser being produced in 1960.
2nd Generation: the years 1975 to 2000
During this period, as in so many of the articles in this series, we see the rapid evolution into the number generating systems we are now so familiar with, and associated with this explosion of data, the requirement to prove the accuracy of these values.
Fluorescence
From a personal perspective, fluorescence was a spectroscopic technique that formed the subject of a dissertation for my degree course, but, in practice, it wasn’t a technique encountered until towards the end of the millennium. This resurgence in general interest in the technique was no doubt initiated by the publication of two reference volumes relating to fluorescence, namely a standards publication by the UVSG in 1981,2 and a technique reference,3 which, now in its 3rd edition, has become synonymous by name only. From a technical perspective, the high sensitivity of the technique promoted its use in application areas requiring lower detection limits. However, this increased application into multiple areas, invariably involved uses in regulated industries such as water quality, pharmaceuticals etc. which, as discussed for other techniques, also prompted the initial drafting of the appropriate standards by international regulatory bodies. Also, in a related development, Polymerase Chain Reaction (PCR) was invented in 1983 by the American biochemist Kary Mullis at Cetus Corporation; Mullis and biochemist Michael Smith, who had developed other essential ways of manipulating DNA, were jointly awarded the Nobel Prize in Chemistry in 1993—but more of this application in the next Generation.
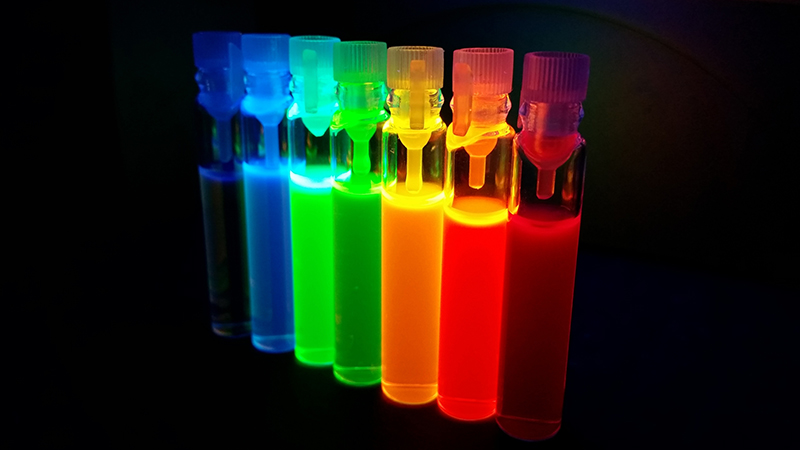
Fluorescence standards
NIR
The NIR (780–2500 nm) region was largely neglected by analysts for many years because of the complex nature of the spectra produced by water, proteins etc. in this region. However, thanks to the many and varied multivariate mathematical calibration approaches made available at the time, broadly described by the term “chemometrics”, it found new and important applications, in the grain and foodstuffs industry for raw material and QA procedures; being promoted by Technicon with their “Infralyser”, registered in April 1986.
Additionally, it was the arrival of FT-NIR instruments in the 1990s and the increasing awareness of NIR’s unique information content in the signal that can provide both physical and chemical information, which catalysed the deployment of NIR spectrometry systems for both qualitative and quantitative purposes within the many industries.
These applications often involve comparing an NIR spectrum from a sample to reference spectra and assessing similarities against acceptance criteria developed and validated for a specific application. In contrast, applications of quantitative analysis involve the development of a predictive relationship between NIR spectral attributes and sample properties. These applications typically use numerical models to quantitatively predict chemical and/or physical properties of the sample based on NIR spectral attributes. Examples include moisture content, content uniformity, hardness, particle size, packing density etc.
Raman
In this period, Raman was still essentially the tool of the research scientist, and it’s only in the next generation that we see it “come of age” as an investigative and/or QA technique. Technological advances made Raman spectroscopy much more sensitive, particularly since the 1980s. The most common modern detectors now being charge-coupled devices, replacing the previously used photodiode arrays and photomultiplier tubes. The advent of reliable, stable, inexpensive lasers with narrow bandwidths has also had an impact with respect to the availability of the technique.
3rd Generation: the years 2000 to 2020
Fluorescence
As stated above, fluorescence detection is used extensively in PCR and the technique became fundamental to many of the procedures used in genetic testing and research, including analysis of ancient samples of DNA and identification of infectious agents. Using PCR, copies of very small amounts of DNA sequences are exponentially amplified in a series of cycles of temperature changes. During this period, PCR became a common and often indispensable technique used in medical laboratory research for a broad variety of applications including biomedical research and criminal forensics. In addition, the latter half of this period, saw the implementation of fluorescence into the clinical and diagnostic marketplace, which culminated in the extensive use of PCR testing for Covid-19 diagnosis.
In addition, coupled with multi-well plate formats, microscopy and optical screening fluorescence has seen a dramatic expansion in its application areas, due in no small part to the development and use of a vast array of highly stable chemical fluorescent probes and markers.
From a personal perspective, this development is analogous to the array, no pun intended, of chemical colorimetric reagents developed in the 1950s to allow the accurate quantitation of metallic species by visible spectro(photo)metry, long before the development of atomic absorption spectroscopy; the most well-known of which is probably Dithizone.
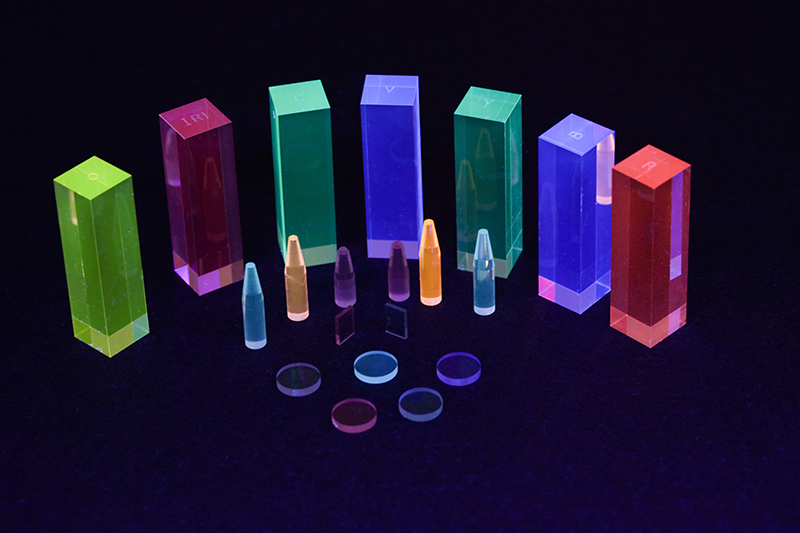
Also, during this period, in the 1980s, we saw the development of Quantum Dots, a uniquely fluorescently active species, where the colour produced on irradiation by “white” light is related to the size (in nm) of the particles; but, like so many developments we have discussed here and in previous articles in the series, interest didn’t really take-off until they became commercially available in the next generation.
Quantum dots
From a regulatory perspective, the drafting of the required standards, for example, ASTM International begun at the end of the previous Generation, were completed in this session.4
NIR
It is the versatility of the available sample presentation modes in the NIR, i.e. fibre-optic probe-based systems, and latterly, small handheld units, combined with the availability of powerful signal process electronics, that revolutionised the use of the technique in two main pharmaceutical areas outside of the Quality Control laboratory during this period.
First, in the Goods-In receiving area of the Raw Materials warehouse, bulk materials could now be checked for identity and compliance to specification, immediately on receipt. As is the case with other spectroscopy measurements, interactions between NIR radiation and matter provide information that can be for both qualitative and quantitative assessment of the chemical composition of samples. In addition, qualitative and quantitative characterisation of a sample’s physical properties can be made because of the sample’s influence on NIR spectra. Example application uses include the identification of fundamentally chemically different compounds, Active Pharmaceutical Ingredients (APIs), excipients, dyes, packaging material, polymorphs, isomers and physical characteristics, such as crystalline vs amorphous.
Second, NIR spectrometry can now provide an invaluable tool in assisting compliance with the pharmaceutical PAT initiative, because probes can easily be mounted within process streams, mixers etc. to allow qualitative analysis of, for example, reaction pathways, drying of a product, granulation, blending and or content uniformity, monitoring of blister-packed final product etc.
Raman
Seen as a complementary technique to NIR in many of the above application areas described for NIR, Raman has found uses in screening systems, from airport security, to identifying drugs, both elicit and counterfeit.
Unsurprisingly, therefore, during this period the United States Pharmacopeia (USP) expanded their spectroscopy General Chapters to include the appropriate 87x and 187x chapters, for both NIR and Raman, as previously described.5
4th Generation: from 2021 forward
As we enter this Generation, we can see that these three spectroscopic techniques are now well developed as mature techniques, with the associated references and regulatory control standards in place. However, we are all aware of the impact of the Covid-19 pandemic over that last two years, and (hopefully) as we begin to exit its dramatic impact we can reflect on the resultant significant shift towards more clinical and/or biological applications of spectroscopy in general.
These changes will be discussed more fully in the next, and last, article in the series, as we “journey into the future” and discuss whether the science fiction of the last decades of the previous millennium is becoming science fact?
References
- J.P. Hammond, “Four Generations of Quality: software and data integrity—an essential partnership?”, Spectrosc. Europe 34(2), 30–35 (2022). https://doi.org/10.1255/sew.2022.a7
- Ultraviolet Spectrometry Group, Standards in Fluorescence Spectrometry, Ed by J.N. Miller. Chapman & Hall (1981). ISBN: 978-94-009-5904-0
- J.R. Lakowicz, Principles of Fluorescence Spectroscopy, 3rd Edn. Springer (2006). https://link.springer.com/book/10.1007/978-0-387-46312-4
- ASTM E2719-09, Standard Guide for Fluorescence—Instrument Calibration and Qualification (2014).
- C. Burgess and J.P. Hammond, “Modernisation of the spectroscopic General Chapters in the United States Pharmacopeia (USP)”, Spectrosc. Europe 27(1), 26–29 (2015). https://doi.org/10.1255/sew.2015.a1; C. Burgess and J.P. Hammond, “Update on the modernisation of the spectroscopic General Chapters in the United States Pharmacopeia (USP)”, Spectrosc. Europe 29(6), 15–17 (2017). https://doi.org/10.1255/sew.2017.a1
John Hammond
John Hammond is an experienced analytical scientist, spectroscopist and technical marketing professional, skilled in the development, production and marketing of analytical systems into highly regulated and controlled industries. A Fellow of the Royal Society of Chemistry (FRSC), executive member of ISO/TC334 and an Expert Advisor to the United States Pharmacopeia, General Chapters, Chemical Analysis committee.
[email protected]
