Nora Bartsch
Application Specialist, Thermo Fisher Scientific, Bremen, Germany
Goal
This application demonstrates the ability of the Thermo Scientific™ iCAP™ PRO Series inductively coupled plasma optical emission spectroscopy (ICP-OES) instrument to determine trace elements and major components in foodstuffs to comply with regulations.
Introduction
Food protection from potentially hazardous contaminants has become a major topic of public interest. As well as the standard regulatory testing, it is necessary to account for contaminants, which may enter the food chain via many means, such as industrial pollution or environmental contamination, i.e., polluted rainfall on crops. Once toxic elements are in the food chain, they can pose significant health risks. With this in mind and the increasing number of micronutrients requiring determination, it is critical that the method of testing is a rigorous and reliable one. The organisation charged with the development of the Codex standards (worldwide food and consumer regulations) is the Codex Alimentarius Commission, which is an intergovernmental body jointly sponsored by the Food and Agriculture Organization and the World Health Organization.
Instrumentation
The Thermo Scientific iCAP PRO Series ICP-OES instrument employs a high-resolution echelle spectrometer with a charge injection device (CID) detector. Advancements in CID technology allow this detector to feature lower noise and better separation of spectral orders than any of its predecessors. With the new optical design, the full spectrum from 167 nm to 852 nm can be measured with a single exposure. A Thermo Scientific™ iCAP™ PRO X Duo ICP-OES instrument was chosen for this analysis as this enables maximum sensitivity using axial view whilst maintaining excellent matrix tolerance in radial viewing mode. The instrument parameters used are listed in Table 1.
Table 1. Instrument parameters.
Parameters | Setting |
Pump tubing | Sample: Tygon® orange/white |
Drain: Tygon® white/white | |
Spray chamber | Glass cyclonic |
Nebuliser | Glass concentric |
Centre tube | 2.0 mm |
Pump speed | 45 rpm |
Nebuliser gas flow | 0.6 L min–1 |
Auxiliary gas flow | 0.5 L min–1 |
Coolant gas flow | 12.5 L min–1 |
RF power | 1150 W |
Exposure time | Axial: 15 s |
Radial: 15 s |
Method development and analysis
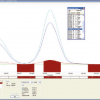
Initially, more than one wavelength was selected for each element (using both axial and radial view). The sub-arrays for each wavelength were then examined and the most appropriate wavelength for the application was chosen (Table 2) based on the presence of interferences, calibration curve quality, QCs and CRMs and the required linearity for the element. The sub-array plots for each element can be easily manipulated by the analyst, allowing the optimum peak integration and background correction points to be selected. The Thermo Scientific™ Qtegra™ Intelligent Scientific Data Solution™ (ISDS) Software was used for data acquisition and provides easy options for post-analysis data manipulation. Qtegra ISDS Software has integrated Quality Control (QC) checks that allows the user to define automatically controlled actions to ensure data integrity, as well as a Flags and Limits function which flags samples according to user specifications.
Table 2. Element, wavelength and plasma view used.
Element | Wavelength (nm) | Plasma view |
Ca | 317.933 | Radial |
Cu | 324.754 | Axial |
Fe | 259.940 | Axial |
Mg | 285.213 | Radial |
Mn | 257.610 | Axial |
Ni | 231.604 | Axial |
P | 178.284 | Radial |
Pb | 220.353 | Axial |
Zn | 206.200 | Axial |
Sample preparation
Samples were prepared using certified reference material (CRM) standards. 0.5 g aliquots of rice flour (NBS1568b) and bovine liver (NBS1577c) were digested in 9 mL TraceMetal™ grade nitric acid (Fisher Chemicals, Loughborough, UK) using a standard food method programme in a high-pressure microwave system. The final digests were made up to 50 mL with deionised water before analysis.
Standard preparation
High purity standards (1000 mg kg–1 single element standards) were used to prepare the calibration standards for this method. All samples and standards were acid matched. Table 3 indicates the concentration of each of the standards, selected to cover the concentration range of the samples.
Table 3. Standard concentrations in mg kg–1.
Element | STD 1 | STD 2 | STD 3 | STD 4 |
Pb | 0.01 | 0.05 | 0.2 | 0.5 |
Mn, Ni, Zn, Cu | 0.1 | 0.5 | 2 | 5 |
Ca, P, Fe, Mg | 1 | 5 | 20 | 50 |
Results
The instrument was calibrated using a blank and at least two standards for each element. After inspection, a linear fit was applied to all elements. The calibration standards and samples were analysed in a single sequence with an acid rinse between samples. The sample data was measured by interpolation and results are shown in Table 4. Suitable dilutions were made to over-range elements to ensure they fell within the calibration range. Method detection limits (MDLs) were also established by analysing the acid matched calibration blank using a ten-replicate analysis and multiplying the standard deviation of the analysis by three. This was repeated three times and the average values for method detection limits are also summarised in Table 4.
Table 4. Results of measurement, CRM and MDLs in mg kg–1 and calculated recoveries in %.
Element | SRM1577c | SRM1568b | MDL | ||||
CRM | Measured | Recovery (%) | CRM | Measured | Recovery (%) | µg kg–1 | |
Ca | 131 | 124 | 95 | 118.4 | 107 | 90 | 1.90 |
Cu | 275.2 | 272.3 | 99 | 2.35 | 2.13 | 91 | 0.4 |
Fe | 197.94 | 205.97 | 104 | 7.42 | 7.78 | 105 | 1.5 |
Mg | 580 | 579 | 100 | 549 | 478 | 87 | 1.23 |
Mn | 10.46 | 10.12 | 97 | 19.2 | 18.1 | 94 | 0.04 |
Ni | 0.0353 | 0.0325 | 92 | — | — | — | 0.52 |
P | — | — | — | 1490 | 1302 | 87 | 12 |
Pb | 0.0628 | 0.0623 | 99 | <MDL | — | — | 2.9 |
Zn | 179.1 | 163.3 | 91 | 19.16 | 15.59 | 81 | 0.28 |
Conclusion
The results table shows that major and trace elements were measured with equal success. Precise, accurate results for digested foodstuff samples are easily attained on the Thermo Scientific iCAP PRO X Duo ICP-OES instrument. The full wavelength coverage of the unique CID detector allowed the optimum wavelengths to be selected and the whole spectrum to be measured with one exposure, while the sensitivity of the axial view provided the low detection limits for this application.
Find out more at: thermofisher.com/icappro