Yun Wang,a,c Yizhi Song,b Di Zhu,a Yuetong Ji,c Tingting Wang,c David McIlvenna,d Huabing Yin,d Jian Xuc and Wei E. Huanga,*
aKroto Research Institute, The University of Sheffield, Broad Lane, Sheffield, S3 7HQ, UK. E-mail: [email protected]
bWellsens Biotech Co. Ltd, Beijing 100044, PR China
cSingle-cell Center, CAS Key Laboratory of Biofuels and Shandong Key Laboratory of Energy Genetics, Qingdao Institute of BioEnergy and Bioprocess Technology, Chinese Academy of Sciences, Qingdao, 266101, PR China
dDivision of Biomedical Engineering, School of Engineering, University of Glasgow, Glasgow, G12 8LT, UK
Introduction
Why Raman micro-spectroscopy is an ideal tool for single cell analysis
A single cell is the basic functional unit of life and all living organisms start from a single cell. Instead of studying “bulk” cells, which may average the behaviour of a large number of cells, studying an individual cell promotes a deeper understanding of cell biology, because: (1) it helps early cancer diagnosis as cancer is usually started from a single mutated cell; (2) it promotes understanding of cell differentiation and development, as stem cells and fertilised eggs start their division and specialisation from a single cell; (3) it unravels the individuality of cells, since individual cells within the same population may differ dramatically due to random fluctuations of gene expression; (4) it reveals the “dark matter” in the microbial world, as the vast majority of micro-organisms (> 99%) are yet to be cultured. Prokaryotes (including eubacteria and archaea) account for about 50% of the total carbon of global biomass1 and are the foundation of our biosphere and biogeochemical cycles (for example, C and N).2 Single cell analysis by Raman micro-spectroscopy circumvents cultivation issues and thus sheds light on those uncultured bacteria in their natural environment.
The most commonly used technique of single cell study is based on the detection of fluorescence, such as fluorescence activated cell sorting (FACS) which labels cells with fluorescent molecules and isolates cells based on their fluorescent signals. Raman micro-spectroscopy is a non-destructive and label-free technology with a capability for detecting and measuring a single cell Raman spectrum (SCRS). A typical SCRS provides an intrinsic biochemical “fingerprint” of a single cell.3 A SCRS contains rich information of the bio-molecules within it, including nucleic acids, proteins, carbohydrates and lipids, which enables us to characterise different cell species, physiological changes and cell phenotypes.4,5,6,7,8,9,10 Therefore, a cell sorting system based on SCRS would be ideal for probing and sorting single cells.
SCRS for probing single cells
A SCRS is a sum of the spectra of all the biomolecules in one single cell, indicating a cell’s phenotypic profile. Cellular phenotypes, as a consequence of gene expression, usually reflect genotypes. Hence, different species give distinct SCRS corresponding to the difference in their genotypes if these species are growing under identical conditions. SCRS has been reported to distinguish bacterial species and even bacteria of the same genus.3
Specific molecules synthesised by a cell would give rise to distinctive Raman signals which then make the cell distinguishable. To date, the SCRS technique has shown that it can be used to identify whether a cell synthesises the following compounds: oil (for example, alkanes) and lipids [for example, triacylglycerols (TAG)], specific proteins (for example, haeme proteins, metalloproteins), cytochrome (for example, P450, cytochrome c), chlorophyll, chromophores (for example, pigments for light harvesting carotenoids and rhodopsins), organic polymers [for example, polyhydroxyalkanoates (PHA), polyhydroxybutyrate (PHB)], hopanoids, steroids, starch, sulfide, sulfate and some secondary metabolites (for example, vitamin B12). With more experimental measurements being increasingly undertaken, the list of compounds that can be identified by Raman spectroscopy is continually being extended.
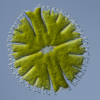
A SCRS indicates the metabolic and physiological state of the cell. It is able to detect cells under various nutrient conditions (for example, N depletion), under physiological stresses and while forming bacterial spore [dipicolinate (CaDPA)]. For example, Figure 1(a) shows that SCRS of an industrial microalgae strain, Nannochloropsis sp., under nitrogen-replete and nitrogen-depleted conditions after 96 h cultivation. In this study, the single cells of Nannochloropsis sp. suspended in water were captured by using a 532 nm laser optical tweezers set-up and their Raman spectra measured using the same excitation laser after the carotenoids and chlorophyll were bleached within 1 s. A comparison between the SCRS and Raman spectrum of pure TAG indicates that the SCRS of nitrogen-depleted Nannochloropsis sp. at 96 h was similar to pure TAG, while the SCRS of the nitrogen-replete cells remain unchanged [see Figure 1(a)]. This suggests that nitrogen depletion should induce TAG accumulation in Nannochloropsis sp. and TAG account for a large proportion of a cell at 96 h.
 Metabolic profiles of Nannochloropsis sp. under nitrogen-replete and nitrogen-depleted conditions at 96 h cultivation show significant changes. (b) SCRS indicate alkane synthesis in the engineered E. coli strain.")
SCRS can contribute to synthetic biology by detecting chemicals synthesised inside a cell. For example, Figure 1(b) shows that an E. coli strain, engineered to synthesise alkanes, had relatively more intense C–H stretching than the wild type and the C–H stretching was derived from alkanes synthesised within the cell. The ratio of the intensity of the C–H stretching (2936 cm–1) to that of the phenylalanine band (1005 cm–1) can be used to evaluate the extent of enhancement of C–H stretching in SCRS. It indicates that the ratio from alkane-producing cells was significantly higher than the wild type cells. In each case, 20 cells were randomly chosen to validate the results.
To probe cell metabolism of specific carbon or nitrogen substrates, Raman micro-spectroscopy can be combined with stable isotope probing (SIP). It has been shown that some bands in SCRS undergo significant “red-shifts” if the cell studied was incorporated with carbon-13 or nitrogen-15 isotopes (see Figure 2) and that the extent of Raman shift is proportional to the ratio of 13C- and 15N-contents in the cell.3,4,5,6,7,9,11,12 The Raman shifts, such as the phenylalanine band at 1005 cm–1 for bacteria [see Figure 2(a)] and the thymine band at 747 cm1 for eukaryotic cells, can be used as biomarkers for the 13C-incoporation. The Raman shift of 13C-SCRS can be up to 38 cm–1. A quantitative relationship can be established between the Raman shift and the content of 13C-incorporation in single cells. Consistent with the observations,6 a theoretical calculation indicates that the Raman bands of phenylalanine and thymine should shift in the same fashion in all cells depending on the 13C-content in a single cell. It suggests that one could quantitatively estimate the 13C-content in unknown single cells using one calibration curve.4 Nitrogen-stable isotope probing is particularly useful because radioactive nitrogen is not available in nature. Hence, SCRS, which is able to detect 15N incorporation at the single cell level, is valuable for probing N metabolism [see Figure 2(b)]. Unlike Raman shifts of 13C-SCRS, some strongly shifted Raman bands (for example, those indicated at 725.9 cm–1, 787.2 cm–1 and 1577.7 cm–1) of 15N-SCRS are putatively assigned to nucleic acids, whilst the phenylalanine band at 1005 cm–1 does not shift.12 Although the shifts of 15N-SCRS (up to 9 cm–1) are less significant than those of 13C-SCRS, different species incorporated with 15N can be clearly classified using principal component analysis (PCA) [see Figure 2(c)]. The shifted Raman bands of SCRS make the metabolically-active cells distinguishable from the rest of the community. This SIP of single cells provides a link between active cells and the metabolism of stable isotope (for example, 13C, 15N) labelled substrates.
 13C and (b) 15N into the cells. (c) Different species incorporated with 15N can be classified by PCA: n, normal cells; s, stable isotope 15N-labeled cells; a, Acinetobacter baylyi ADP1; e, E. coli DH5a; p, Pseudomonas putida NCIB9816; s, Pseudomonas syringae DC3000; u, Pseudomonas putida UWC1.")
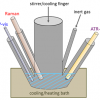
Raman micro-spectroscopy can also be coupled with other technologies, such as fluorescence in situ hybridisation (FISH) to enable Raman–FISH measurements, optical trapping technology to enable Raman–tweezer studies and, more recently, with atomic force microscope, to undertake tip-enhanced Raman scattering (TERS) measurements. All these combinations have illustrated the great potential of Raman single cell technology.
Rapid single cell Raman micro-spectroscopy system
One key drawback of Raman micro-spectroscopy is that the Raman signal is naturally weak.13 This has hampered the development of high-throughput single cell Raman technology. Thus, it is essential to be able to reduce the Raman acquisition time in order to achieve rapid screening. Recently, the acquisition time of a spontaneous single cell Raman spectrum was reduced to 0.1–0.5 s using optimised settings such as shortening the Raman light path, employing a low noise and sensitive electron-multiplying charge-coupled device (EMCCD) for the Raman signal detection, and by increasing the incident laser power. Furthermore, resonance Raman measurements can shorten SCRS to 1 ms when the cells contain resonance Raman active molecules such as carotenoids.5,14 When the cells are probed with nano-particles such as nano-silver or nano-gold particles, surface enhanced Raman scattering (SERS) would significantly enhance the Raman signals, enabling rapid Raman spectral acquisition from single cells and extremely sensitive detection of single molecules within a cell. SERS can enhance Raman signals up to 10 to 14 orders of magnitude.13
Raman activated cell screening and sorting
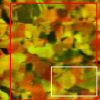
It would be desirable not to only be able to observe the cells of interest by probing the cells using Raman micro-spectroscopy but also to isolate them for further studies such as attempted cultivation or genomic sequencing. The Raman tweezers method, which combines single cell Raman measurement and optical tweezers, has been employed to isolate cells of interest utilising SCRS.11 However, the throughput of the Raman tweezers technique is limited. The integration of Raman micro-spectroscopic detection and microfluidic-based cell sorting can potentially achieve high-throughput sorting. A set-up of Raman-activated cell sorting (RACS) with a microfluidic device is shown in Figure 3. Bacteria are injected via the middle channel in the device, converge in the centre line of the channel [Figure 3(b)] and are then examined by Raman micro-spectroscopy to obtain their SCRS [Figure 3(c)]. We have recently proved the concept that this set-up can achieve Raman-activated cell counting which counts cells based on their characteristic SCRS.14 In this case, Synechocystis sp. PCC6803 was used, which contains carotenoids and generates a strong resonance Raman spectrum when excited by a 532 nm laser with an acquisition time of 1 ms [Figure 3(c)]. The SCRS from the cells incorporated with 13C–CO2 shifted in comparison with those from cells taking up 12C–CO2.
 A microfluidic device was loaded under a Raman micro-spectroscopic instrument. (b) A bright field image of the device (top) and a fluorescence image of the converging flow in the centre of microfluidic channel with 100 µm width (bottom). (c) Original Raman spectra of Synechocystis sp. PCC6803: 13C-cell, red spectrum and 12C-cell, green spectrum. The n1 Raman band was used as the marker to differentiate cells during the cell counting. (d) A time window that shows the intensity of the n1 band at ca 1516 cm–1 against the temporal axis and displayed in green and red for 12C-cells and 13C-cells, respectively.")
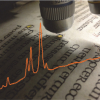
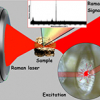
Using this flow-based Raman sorting it would be difficult to sort cells from a complex environment, such as bacteria in soils and pathogens associated with tissues, because particles and tissues would block the microfluidic channel. Raman-activated cell ejection (RACE) has been developed to measure SCRS and accurately sort cells on a slide (Figure 4). RACE integrates single-cell Raman analysis with single-cell ejection that is assisted by laser-induced forward transfer (LIFT). In LIFT, a pulsed laser is focused through a transparent substrate onto a light-absorbing layer. Cells on the slide (Wellsens Co., China) can be randomly chosen to obtain their SCRS. Among these cells, for example, one cell was identified as a 13C-cell [Figure 4(a)], because its phenylalanine band in SCRS showed significant shift from 1003 cm–1 to 967 cm–1 [Figure 4(b)]. The absorbing layer disintegrates upon irradiation and provides forward momentum to the material positioned on top of the light absorber and the cell at that point upon the absorbing layer can be isolated and collected [Figure 4(c)]. Subsequently, the cell can be processed by attempted cultivation or DNA/RNA amplification for sequencing [Figure 4(d)].
 Bacteria on a specific slide coated with laser absorbing material (Wellsens Co. China). (b) The cells circled in (a) are found to be 13C-cells according to SCRS. (c) The cell of interest was ejected using LIFT. (d) The genome of the isolated cell was amplified using single-cell multiple displacement amplification.")
Conclusions
The SCRS-based cell probing and sorting approach provides an entirely novel approach to study phenotypes and ecophysiology of single cells and explore individual cells in situ in a label-free and non-destructive manner. It is essential to reduce Raman acquisition time to achieve rapid cell sorting. Over the past few years, technology advances in higher power lasers and low noise detectors (for example, the EMCCD camera used in this study) provide an opportunity to increase Raman signals significantly. It is possible, in the near future, that the acquisition time of SCRS can be significantly decreased to sub-second level by optimisation of the Raman system and application of resonance Raman and SERS.
Probing and sorting cells based on SCRS will revolutionise our ability to study the roles of single cells and uncultured bacteria in complex microbial communities. It will become a powerful research tool to open a new frontier for the isolation of individual live cells for attempted cultivation and for developing single-cell “-omics” technologies, such as single cell genomics, which was envisioned in 2012 as one of the top research priorities for the next ten years by the US Department of Energy.15
Acknowledgements
We acknowledge support from the Ministry of Science and Technology of China (MOST 2011IM030100). We thank Wellsens Biotech Co. Ltd (Beijing, China) for technical support on RACS and RACE.
References
- W.B. Whitman, D.C. Coleman and W.J. Wiebe, “Prokaryotes: The unseen majority”, Proc. Nat. Acad. Sci USA 95, 6578 (1998).
- P.G. Falkowski, T. Fenchel and E.F. Delong, “The microbial engines that drive earth’s biogeochemical cycles”, Science 320, 1034 (2008). doi: 10.1126/science.1153213
- W.E. Huang, R.I. Griffiths, I.P. Thompson, M.J. Bailey and A.S. Whiteley, “Raman microscopic analysis of single microbial cells”, Anal. Chem. 76, 4452 (2004). doi: 10.1021/ac049753k
- M.Q. Li, W.E. Huang, C.M. Gibson, P.W. Fowler and A. Jousset, “Stable isotope probing and Raman spectroscopy for monitoring carbon flow in a food chain and revealing metabolic
- M. Li, D.P. Canniffe, P.J. Jackson, S. FitzGerald, M.J. Dickman, P.A. Davison, J.G. Burgess, C.N. Hunter and W.E. Huang, “Rapid resonance Raman microspectroscopy to probe carbon dioxide fixation by single cells in microbial communities”, ISME J. 6, 875 (2012). doi: 10.1038/ismej.2011.142
- W.E. Huang, K. Stoecker, R. Griffiths, L. Newbold, H. Daims, A.S. Whiteley and M. Wagner, “Raman–FISH: combining stable-isotope Raman spectroscopy and fluorescence in situ hybridization for the single cell analysis of identity and function”, Environ. Microbiol. 9, 1878 (2007). doi: 10.1111/j.1462-2920.2007.01352.x
- W.E. Huang, A. Ferguson, A.C. Singer, K. Lawson, I.P. Thompson, R.M. Kalin, M.J. Larkin, M.J. Bailey and A.S. Whiteley, “Resolving genetic functions within microbial populations: In situ analyses using rRNA and mRNA stable isotope probing coupled with single cell Raman–FISH”, Appl. Environ. Microbiol. 75, 234 (2009).doi: 10.1128/AEM.01861-08
- W.E. Huang, M.J. Bailey, I.P. Thompson, A.S. Whiteley and A.J. Spiers, “Single-cell Raman spectral profiles of Pseudomonas fluorescens SBW25 reflects in vitro and in planta metabolic history”, Microb. Ecol. 53, 414 (2007). doi: 10.1007/s00248-006-9138-5
- S. Haider, M. Wagner, M.C. Schmid, B.S. Sixt, J.G. Christian, G. Hacker, P. Pichler, K. Mechtler, A. Muller, C. Baranyi, E.R. Toenshoff, J. Montanaro and M. Horn, ” Raman microspectroscopy reveals long-term extracellular activity of chlamydiae”, Mol. Microbiol. 77, 687 (2010). doi: 10.1111/j.1365-2958.2010.07241.x
- J.S. Andrews, S.A. Rolfe, W.E. Huang, J.D. Scholes and S.A. Banwart, “Biofilm formation in environmental bacteria is influenced by different macromolecules depending on genus and species”, Environ. Microbiol. 12, 2496 (2010). doi: 10.1111/j.1462-2920.2010.02223.x
- W.E. Huang, A.D. Ward and A.S. Whiteley, “Raman tweezers sorting of single microbial cells”, Environ. Microbiol. Rep. 1, 44 (2009). doi: 10.1111/j.1758-2229.2008.00002.x
- W.E. Huang, M.Q. Li, R.M. Jarvis, R. Goodacre and S.A. Banwart, “Shining light on the microbial world: the application of Raman microspectroscopy”, Adv. Appl. Microbiol. 70, 153 (2010). doi: 10.1016/S0065-2164(10)70005-8
- M.Q. Li, J. Xu, M. Romero-Gonzalez, S.A. Banwart and W.E. Huang, “Single cell Raman spectroscopy for cell sorting and imaging”, Curr. Opin. Biotechnol. 23, 56 (2012). doi: 10.1016/j.copbio.2011.11.019
- M.Q. Li, P.C. Ashok, K. Dholakia and W.E. Huang, “Raman-activated cell counting for profiling carbon dioxide fixing microorganisms”, J. Phys. Chem. A. 116, 6560 (2012).doi: 10.1021/jp212619n
- H. Bolton et al. A 10-Year Strategic Vision, Forging the Future of the DOE JGI, Ed by US Department of Energy. (2012). www.jgi.doe.gov/whoweare/10-Year-JGI-Strategic-Vision.pdf