Antony N. Davies,a,b Shane R. Ellis,c Benjamin Balluffc and Ron M. Heerenc
aStrategic Research Group – Measurement and Analytical Science, Akzo Nobel Chemicals b.V., Deventer, the Netherlands
bSERC, Sustainable Environment Research Centre, Faculty of Computing, Engineering and Science, University of South Wales, UK
cMaastricht MultiModal Molecular Imaging Institute M4I, Universiteitssingel 50, 6229 ER Maastricht, The Netherlands
For many analytical spectroscopists, data handling challenges arise every few years when the space on the USB stick used to move data between the spectrometer and the office computer becomes full. With the founding of the Maastricht MultiModal Molecular Imaging Institute M4I at the Brightlands Maastricht Health Campus and the associated appointment of two new Professors, the interests of Professor Ron Heeren with the Division of Imaging Mass Spectrometry and Professor Peter Peters and the Division of Nanoscopy, a perfect storm of data has been created. At the largest molecular imaging centre in Europe, Ron Heeren’s group study high-resolution molecular imaging of biological systems and polymers through the development and application of state-of-the-art mass spectrometry based molecular imaging approaches for nanomedicine and biomedical research. Peter Peters’ team use techniques such as high-resolution cryo-electron microscopy to investigate complex protein structures in cells. This far-sighted strategic decision by Maastricht University has attracted significant funding to the location and has allowed an unrivalled capability to be established which is still growing.
Size of the data storm
Working together with some of the major instrument vendors in our field they are now generating data at the rate of 100s of GBytes/day. These large amounts of data need to be rapidly and securely stored in a location which is also designed to be able to serve this data back to the individual researchers when they need to begin the task of data analysis and processing, a significant challenge within itself. An example of the state-of-the-art development work being undertaken with commercial companies is the beta testing of a new parallel imaging MS/MS nanoTOF II from Physical Electronics (PHI) (Figure 1) where the TOF-SIMS spectrum (MS1) and the MS/MS spectrum (MS2) are acquired in parallel. This high-information-volume methodology allows researchers to directly compare spectra, images or depth profiles from MS1 and MS2 of the same three-dimensional volume containing hundreds of thousands or more pixels.

Figure 1. The new Physical Electronics NanoToF II tandem SIMS system in operation at M4I in Maastricht.
On another new instrument, the Bruker rapifleX MALDI Tissuetyper™ time-of-flight (TOF) which offers acquisition rates up to 50 times faster than other MALDI imaging systems, they have generated results from experiments that were performed on brain sections with pixel sizes ranging from 10 × 10 µm2 to 50 × 50 µm2. The data generated in both positive- and negative-ion modes yielded information-rich and complementary lipid spectra revealing the spatial changes of the lipidome composition throughout the mouse brain. The speed of the instrument allowed an entire mouse brain to be imaged consecutively in both positive- and negative-ion mode in ~35 minutes.1 These high acquisition speeds allow work on new classes of matrices that are unstable under high vacuum for MALDI-MSI studies, but, of course, this means large amounts of data are now acquired much faster, thus placing further demands on IT infrastructure. A typical experiment from this instrument (see Figure 2) yields data at around 10–100 GB per tissue. In this particular case the raw data stream is made up of over 181,000 individual mass spectra measured at a resolution of 20 µm. Of course such advancements open the way to analysis of large tissue cohorts for clinical studies. In this respect TBs of raw data are expected which must be treated carefully along with the confidential, associated patient data.

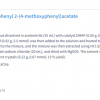
Figure 2. (a) Positive-ion images of [PC(40:6)+K]+, [PC(38:6)+K]+ and [PC(36:1)+K]+ observed at m/z 972, 844 and 826 and shown in red, blue and green, respectively, acquired with a 20 × 20 μm raster. This image contained 181,723 pixels. (b) Enlarged region showing the complementary distributions of these ions in the cerebellum. The corresponding H&E-stained section is shown on the right. Reproduced from Reference 1 with permission; © 2015 John Wiley & Sons Ltd.
Another area of large data production and analysis in this group at Maastricht is from the team working on developing the medical applications of the Waters iKnife Rapid Evaporative Ionisation Mass Spectrometry (REIMS) systems and their associated databases. This system allows for molecular analysis of surgically removed tissue in real-time during the cutting process by collecting the smoke produced and introducing it into a mass spectrometer (in this case a Xevo system from Waters). It relies heavily on the generation and access to tissue and disease-specific databases that are compared to the molecular profile of the tissue in contact with the surgical knife. It thus provides real-time feedback to surgeons as to the type of tissue they are cutting and allows the differentiation of tumorous and healthy tissue. This critical information, based on a series of collected mass spectra, helps ensure all tumorous tissue is removed and minimises the need for follow-up surgery.
Weathering the storm—data handling infrastructure
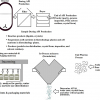
In order to efficiently master the in-house data tsunami and to provide the researchers with the opportunity of actually interpreting the data volumes and converting them into knowledge (with the associated publications of course!) the following infrastructure has been put in place (see Figure 3).

Figure 3. Very rough outline of the data generation to publication pathway at M4I.
The demands on that IT-infrastructure in data handling are two-fold: on one side huge amounts of data have to be stored somewhere (storage space), as the data produced surpasses standard PC storage possibilities. And on the other hand, this amount of data has to be moved in a short amount of time from and to the storage (network speed).
At the M4I, a petabyte centralised storage system from Hitachi Data Systems has been installed which is connected via Gigabit–Ethernet connections to the instruments, data analysis clients and university network. In order to reduce the data transfer rates between the storage and the data analysis units, the mass spectrometry imaging (MSI) data is processed and reduced on the fly during acquisition. The latter can lead to a 100- to 1000-fold reduction, depending on the type of data, enabling acceptable response times for the analysis by the researcher. Also MSI data can benefit tremendously from parallelised processing, as an MSI dataset is a collection of individual mass spectra where each spectrum can be treated separately. Hence, commercial as well as in-house developed software make use of multi-core processing systems. At the Maastricht University there are currently two nodes of 64 cores and each with 512 GB RAM memory available. As a partner in the Dutch Life Science Grid, it is possible to upscale to greater computational power using clusters of other participating centres.
Another important pillar for data analysis, successful interpretation and generation of relevant results, is an IT-infrastructure for the integration of the data with other data. In the context of projects that run in collaboration with the Academic Hospital of Maastricht (AZM), this can be clinical data or other types of data that has been obtained by other techniques from the same sample/patient (e.g. genomic data, MRI scans etc.) Other data can also be meta-data related to the experiment such as instrument settings during data acquisition or the sample preparation protocol. This IT-infrastructure of storage and integration also enables to fulfill the requirements of the FAIR data criteria.
FAIR data
The M4I is, with other Dutch-based research groups, a member of the Dutch Techcentre for Life Sciences (DTL) who are promoters of the FAIR Data approach (http://www.dtls.nl/fair-data/). Long-term readers of this column will have no difficulty in recognising and welcoming the ideals behind the FAIR data approach. As they describe it data should be:
Findable—easy to find by both humans and computer systems and based on mandatory description of the metadata that allow the discovery of interesting datasets;
Accessible—stored for the long term such that they can be easily accessed and/or downloaded with well-defined license and access conditions (Open Access when possible), whether at the level of metadata or at the level of the actual data content;
Interoperable—ready to be combined with other datasets by humans as well as computer systems;
Reusable—ready to be used for future research and to be processed further using computational methods.
As such the DTL is working with similarly interested international bodies on the FAIR Data Stewardship of scientific information (https://www.force11.org/group/fairgroup/fairprinciples).
These lay down exactly what steps an organisation needs to take in order to meet the ideals of the FAIR data approach. This is still work in progress but is very well aligned as general principles for sensible Big Data archiving not only in the bio-spectroscopy fields but for all of us regardless of our specific areas of interest.
To be Findable:
F1. (meta)data are assigned a globally unique and eternally persistent identifier
F2. data are described with rich metadata
F3. (meta)data are registered or indexed in a searchable resource
F4. metadata specify the data identifier
To be Accessible:
A1. (meta)data are retrievable by their identifier using a standardised communications protocol
A1.1. the protocol is open, free and universally implementable
A1.2. the protocol allows for an authentication and authorisation procedure, where necessary
A2. metadata are eternally accessible, even when the data are no longer available
To be Interoperable:
I1. (meta)data use a formal, accessible, shared and broadly applicable language for knowledge representation.
I2. (meta)data use vocabularies that follow FAIR principles
I3. (meta)data include qualified references to other (meta)data
To be Re-usable:
R1. meta(data) have a plurality of accurate and relevant attributes
R1.1. (meta)data are released with a clear and accessible data usage license
R1.2. (meta)data are associated with their provenance
R1.3. (meta)data meet domain-relevant community standards
Conclusions
In conclusion it is very pleasing to see not only significant investment into advanced spectroscopic techniques being made in Europe during economically difficult cycles, but also that the longer-term future of the spectroscopic data is also at the forefront of the minds of those fortunate enough to be receiving this support and a key enabler of their strategy and, we are confident, of their future success.
References
- N. Ogrinc Potocˇnik, T. Porta, M. Becker, R.M. Heeren and S.R. Ellis, “Use of advantageous, volatile matrices enabled by next-generation high-speed matrix-assisted laser desorption/ionization time-of-flight imaging employing a scanning laser beam”, Rapid Commun. Mass Spectrom. 29, 2195–203 (2015). doi: http://dx.doi.org/10.1002/rcm.7379