Andreas Noelle* and Gerd. K. Hartmann
science-softCon, Auf der Burg 4, 63477 Maintal, Germany. E-mail: [email protected]
The science-softCon UV/Vis+ Photochemistry Database (www.photochemistry.org) is a large and comprehensive collection of extended ultraviolet, vacuum ultraviolet, ultraviolet, visible and near infrared spectral data and other photochemical information assembled from published peer-reviewed papers. The database contains photochemical data including absorption, fluorescence, photoelectron, and circular and linear dichroism spectra, as well as quantum yields and photolysis-related data that are critically needed in many scientific disciplines. This article gives an outline regarding the structure and content of the science-softCon UV/Vis+ Photochemistry Database. The accurate and reliable molecular level information provided in this database are fundamental in nature and help in proceeding further to understand photon-, electron- and ion-induced chemistry of molecules of interest, not only in spectroscopy, astrochemistry, astrophysics, Earth and planetary sciences, environmental chemistry, plasma physics, combustion chemistry, but also in applied fields such as analytical chemistry, medical diagnostics, pharmaceutical sciences, biochemistry, agriculture and catalysis.
Introduction
Photochemical data and information such as absorption spectra, fluorescence spectra, photoelectron spectra, circular and linear dichroism spectra, quantum yields etc. are important parameters needed in many scientific disciplines. Back in 1999, there was deemed to be a need for publicly accessible on-line databases containing such data and information in digital format (machine-readable). A first UV/Vis Spectra of Atmospheric Constituents CD-ROM1 was published which contained, at that time, the largest collection of ultraviolet/visible (UV/vis) spectral data available free-of-charge. Based on this CD and the motivation to provide spectral data and information in digital format to the scientific community via the World Wide Web, the UV/Vis Spectra Database went on-line in August 2000 as a non-profit project.
In the beginning, the on-line database contained about 1200 spectra/datasheets for 120 substances and the compiled data extended beyond atmospheric research to allow for interdisciplinary application. To enable platform independent usability, both the spectral data as well as the datasheets (metadata such as publication, authors, source, wavelength range, temperature, pressure, phase etc.) are available as plain ASCII text. To guarantee the high quality of the fast growing UV/Vis+ Spectra Database, an international “Scientific Advisory Group” (SAG) was established in 2004, and the database was operated in accordance with the “open access” definitions and regulations of the CSPR Assessment Panel on Scientific Data and Information (International Council for Science, 2004, ICSU Report of the Committee on Scientific Planning and Review Assessment Panel on Data and Information).2
Since 2004, in addition to publishing the on-line database, every two years a mirror of the on-line database has been published on CD-ROM. The latest edition in the science-softCon UV/Vis+ Spectra Database series was published in 2019.3 The on-line database currently (as of July 2020) contains about 14,200 spectra/datasheets as well as 5300 graphical representations for about 3000 substances, and is sub-divided into 28 substance groups (e.g. hydrocarbons, pharmaceuticals, pesticides, polycyclic aromatic hydrocarbons etc.). The database is updated weekly. In addition to the inclusion of new data, a main focus of the database is the preservation of data from older publications.
A more detailed description of the database and its applications has been published recently.4
As mentioned by the CSPR Assessment Panel on Scientific Data and Information, database maintenance and management are costly.2 Collection of data, preparation of metadata and provision of professional data management expertise and institutional support for data dissemination and permanent archiving will add to the overall expense of specific research projects and maintaining the larger research infrastructure.
“Full and open access” to data implies equitable, non-discriminatory access to all data that are of value for science. It does not necessarily equate to “free of cost” at the point of delivery. There are several economic models for providing scientists with access to data for research and education.2 The UV/Vis+ Photochemistry Database allows free and open access to all metadata, and cost-recovery pricing for data (or data licenses) in order to support the full data infrastructure. A choice of charged subscriptions giving full access to the data are available: for example an annual campus-wide licence provides full access to all data and information for less than USD1 per day (for universities, governmental organisations, non-profit organisations) and a “One-Time Registration” licence allows perpetual access to all data and information. Both licenses include a copy of the 12th edition of the UV/Vis+ Spectra Database CD-ROM.3 In addition, those colleagues who support us in maintaining the database through the provision of new or missing data and information can get personal free-of-charge access to all data and information. More information is available at www.photochemistry.org.
Database structure and content
The database contains spectral information (gas, liquid and solid phase) from the extreme ultraviolet to the near infrared spectral regions (EUV-VUV-UV-Vis-NIR) and related data (e.g. information concerning publications on quantum yield studies or photolysis studies) from published peer-reviewed papers. Besides absorption spectra, which comprise most of the available data, fluorescence spectra, photoelectron spectra, circular and linear dichroism spectra, quantum yields etc. are available. The database is structured into 28 categories, which just provide a rough classification.
The datasheets provide metadata (substance name, formula and CAS number, data source, full reference, including title, authors, journal and DOI when available, spectral range and resolution, temperature, pressure, phase etc.), as well as data in various forms obtained and presented in the literature. This includes, for example, absorption data measured over a specific wavelength/energy range in tabulated form. In many applications (e.g. quantum yield studies or photolysis studies), the absorption cross-section (σ) or the molar extinction coefficient (ε) at a specific wavelength (λ) are determined, and these single wavelength data are also included in the database. For many substances temperature dependent data are available.
Most of the available data are from published peer-reviewed papers (>99 %), data presented at scientific meetings and conferences are also available (<0.5 %), as well as data from PhD theses, reports and unpublished material (<0.5 %). As an example of the database structure and contents, absorption data of carbonyl fluoride (COF2) from three different sources are presented in Figure 1. The data sets are as provided by the authors or listed in the relevant publications. To enable platform independent usability, all data are provided as plain ASCII text.
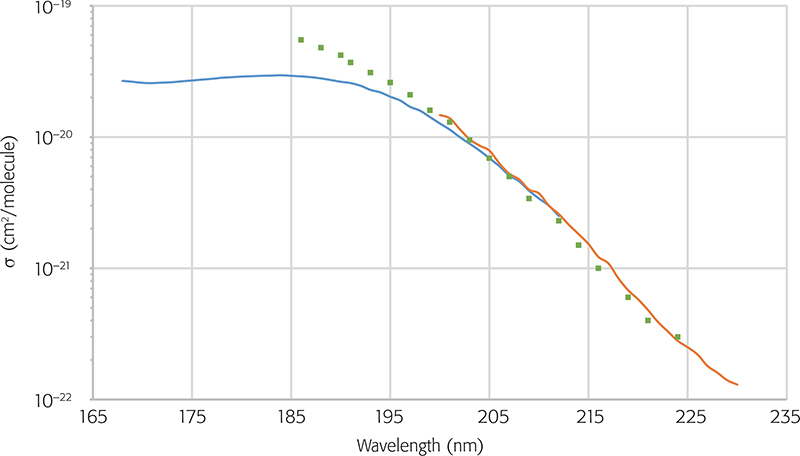
Figure 1. UV absorption spectrum of COF2 obtained by Noelle5 (blue curve), Noelle et al.6 (red curve) and Molina and Molina7 (green squares).
More recently, almost 3000 graphical representations, mostly from older publications have been digitised and added to the database. In addition, we have converted more than 100 datasets from “floppy discs” and hence prevented these data from being lost as technology has evolved.
Since 2019 the database has been extended to include circular and linear dichroism spectral data (Figure 2). The absorbance curves were recorded with the electric vector of the sample beam parallel and perpendicular to the stretching direction of the polyethylene polymer.
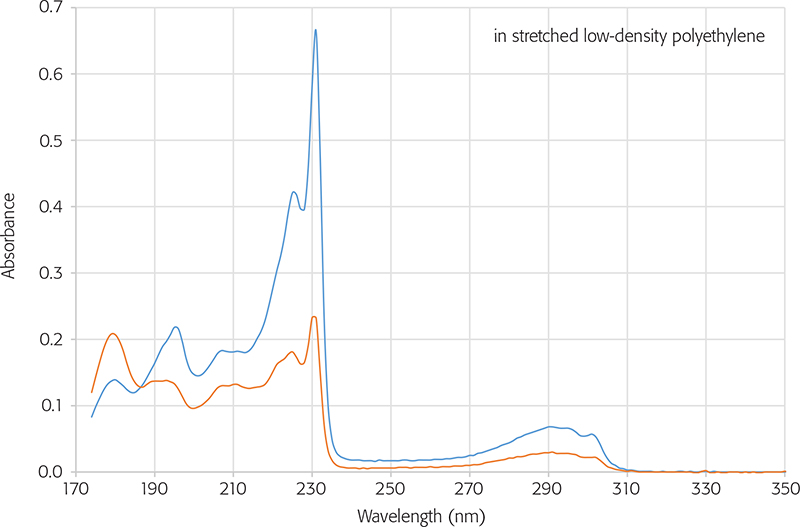
Figure 2. Linear dichroism absorbance spectrum of dibenzo-p-dioxin.8 The absorbance curves were recorded with the electric vector of the sample beam parallel (blue line) and perpendicular (orange) to the stretching direction of the polyethylene polymer.
Outlook
The science-softCon UV/Vis+ Photochemistry Database is continually evolving and growing. As of July 2020, it contains about 14,200 spectra/datasheets as well as 5300 graphical representations for about 3000 substances and is sub-divided into 28 substance groups (e.g. hydrocarbons, pharmaceuticals, pesticides, polycyclic aromatic hydrocarbons etc.) This is a tremendous effort and requires a lot of manpower, not to mention technical infrastructure. We hope that the database proves useful to the scientific community and will facilitate their day-to-day work.
Since the support by the scientific community is crucial for such a photochemistry database, we would like to encourage all colleagues to assist us in maintaining the database and join our initiative “Photochemical Data and Information Sharing Platform—Share Photochemical Data & Information, Find Answers”.
This initiative should develop the photochemical database towards a photochemical data sharing platform. The advantage of such a photochemical data sharing platform is that the more scientists provide their data for inclusion in the database, the better is the chance for all users to find specific photochemical data within the database. In addition, the platform becomes increasingly beneficial for use across multiple disciplines.
Database examples (datasheet, data, graph) are available at www.photochemistry.org.
Since the “UV/Vis+ Photochemistry Database” is operated as a non-profit “open access” database, any support from both sides, academic and commercial, would be highly appreciated.
Acknowledgements
The authors would like to thank the members of the SAG and the colleagues who support us in maintaining the database.
References
- A. Noelle, F. Pätzold, S. Pätzold, R. Meller, G. Moortgat, E.P. Röth, R. Ruhnke and H. Keller-Rudek, UV/Vis Spectra of Atmospheric Constituents. DLR Publication (1998). ISBN: 3-89100-030-8
- Scientific Data and Information. A Report of the CSPR Assessment Panel on Scientific Data and Information, International Council for Science (ICSU) (2004). ISBN: 0-930357-60-4, https://council.science/wp-content/uploads/2017/05/PAA_Data_and_Information_report.pdf
- A. Noelle, G.K. Hartmann, A. Fahr, D. Lary, Y.-P. Lee, P. Limao-Vieira, R. Locht, F.J. Martin-Torres, K. McNeill, J.J. Orlando, F. Salama, A.C. Vandaele, R.P. Wayne and B.N. Rajasekhar, UV/Vis+ Spectra Database, 12th Edn. science-softCon (2019). ISBN: 978-3-00-063188-7
- A. Noelle, A.C. Vandaele, J. Martin-Torres, C. Yuan, B.N. Rajasekhar, A. Fahr, G.K. Hartmann, D. Lary, Y.P. Lee, P. Limao-Vieira, R. Locht, K. McNeill, J.J. Orlando, F. Salama and R. Wayne, “UV/Vis+ photochemistry database: Structure, content and applications”, J. Quant. Spectr. Rad. Transfer 253, 107056 (2020). https://doi.org/10.1016/j.jqsrt.2020.107056
- A. Noelle, Bestimmung von Quantenausbeuten und Absorptionsquerschnitten von COF2 und COFCl im UV-Bereich. PhD Thesis, University Frankfurt, Germany (1996).
- A. Noelle, H. Heydtmann, R. Meller, W. Schneider and G. Moortgat, “Absorption spectrum and absorption cross sections of COF2 at 296 K in the range 200–230 nm”, Geophys. Res. Lett. 19(3), 281–284 (1992). https://doi.org/10.1029/91GL02316
- L.T. Molina and M.J. Molina, “Chemistry of fluorine in the stratosphere”, in 182nd American Chemical Society National Meeting, New York (1982).
- D.D. Nguyen, N.C. Jones, S.V. Hoffmann and J. Spanget-Larsen, “Electronic states of dibenzo-p-dioxin. A synchrotron radiation linear dichroism investigation”, Chem. Phys. 519, 64–68 (2019). https://doi.org/10.1016/j.chemphys.2018.12.003