
Mattia Cesa
Department of Life Sciences, University of Trieste, Via L. Giorgieri 10, I-34127 Trieste, Italy. E-mail: [email protected]
Introduction
The intense development of industrial and urban areas in the absence of accurate measures to control pollution sources is often the cause of several environmental problems: dispersed and undetected chemical waste problems, in particular trace elements such as heavy metals, may cause freshwater, soil and water-table contamination. Such events are rarely detectable by sporadic analyses on water samples, since trace element concentrations are often below the instrumental detection limits and/or quickly change in space and time.
The European Parliament has approved the directive 2000/60/CE to adopt alternative techniques integrating the usual methods of water quality assessment (see: http://eur-lex.europa.eu/LexUriServ/LexUriServ.do?uri=CELEX:32000L0060:EN:NOT). Since the 1970s, several European researchers have successfully used biological accumulators to monitor metal pollution in freshwaters, particularly focusing on aquatic bryophytes (mosses and liverworts). These plants have anionic chemical groups on the cell wall, which act as non-selective binding (or exchange) sites for micronutrients and elements in the cationic form. Since the enrichment ratios, both under laboratory conditions and in the field, range between 103 and 105, aquatic bryophytes are particularly indicative for the assessment of sporadic events.
Bryophytes may be collected from the survey area or easily transplanted from an unpolluted spring to the monitoring site: the so-called Moss Bags technique provides many advantages compared to the sampling of autochthonous individuals: use of unique selected species, availability of an adequate amount of material whatever the site and concentrations referred to a measurable exposure time.
This article presents briefly the results obtained in NE Italy, thanks to the funding allocated by the Province of Vicenza, some Municipalities and Water Basin Authorities, the analytical and logistical support of the Agency for Environmental Protection of the Veneto Region (A.R.P.A.V.) and the collaboration of many volunteers. After some preliminary studies,1,2,3 which confirmed the suitability of aquatic mosses—especially transplants in bags—to detect and characterise different patterns of pollution, the three-year Vicenza Moss Bags Project led to the calibration of Palladio, the first index of environmental alteration based on moss bags.4 In addition, some experiments under laboratory conditions allowed interesting aspects of the bio-accumulation processes in aquatic mosses to be observed.5 Finally, an equation to estimate the mercury concentration in the water, in case of micro-contamination, was produced.6
Materials and methods
Two species of aquatic mosses are usually employed in biomonitoring, because of their widespread occurrence and uptake capacity: Fontinalis antipyretica (Hedw.) and Rhynchostegium riparioides (Hedw.) C.E.O. Jensen [= Platyhypnidium riparioides (Hedw.) Dixon]. We have always used the latter. According to a widely accepted method,2 we collect submerged tufts from an unpolluted spring and place them into bags made of a plastic net. Moss bags are then transferred to a special aquarium we use to carry out laboratory experiments, or to a stretch of the river we want to survey. The exposure period ranges from a few days to several weeks, depending on the scope of the survey; intermediate samplings may be taken to observe the uptake trend.
After exposure, plants are rinsed for a few seconds in bi-distilled water to remove large particles and compounds not fixed to the cell wall. The apical parts (2–4 cm) of moss branches are selected for analyses, dried at 45°C for two or more days, weighed (100–200 mg, residual water content 4–8%), then totally mineralised at high temperature (200°C) and pressure (75 bar) in quartz containers with a solution of 2.5 mL HNO3 65% and 0.5 mL H2O2 30%. 1.5 mL of HF 50% may be added after digestion to complete the dissolution of silicates.
Trace element concentrations are determined by atomic absorption spectrophotometry: an air/NO2 flame is used for Al, the air/acetylene flame for Cu, Fe, Mn and Zn, the graphite furnace for Cd, Co, Cr, Ni, Pb, Pd, Pt, Sb and V and cold vapour and hydride generation for As, Hg and Se. The certified reference material BCR-060 was systematically adopted to control the percentage recovery.
The total concentration measured in exposed mosses (mg kg–1) may be converted into a Contamination Factor, when it is related to the same value measured from a control station (local blank), or to the background value of the survey area, if available.
Results and discussion
Examples of intermittent pollution are shown in Figure 1: three stations (represented by E, F and G were placed along an irrigation ditch where some galvanic industries discharged their wastes.2 No elevated concentrations of Cr were reached at any station until 50 days, when a moderate pollution event occurred at the upstream station E. This acute contamination was revealed by the moss, which also showed a dilution effect from E (94 mg kg–1) to F (29 mg kg–1). Moss bags at station G did not register any contamination until they were lost.
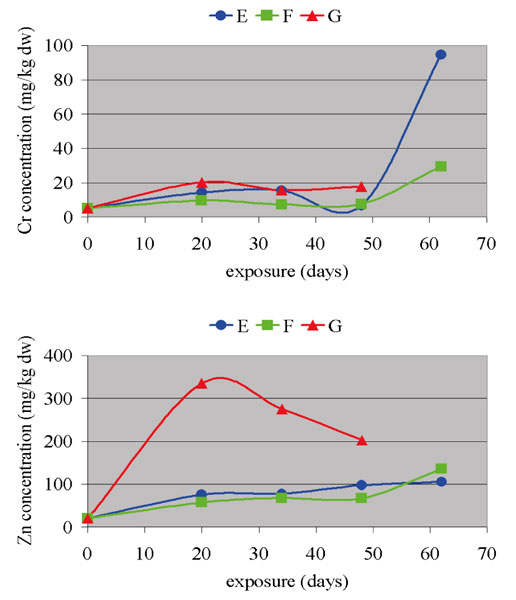
Figure 1. Examples of intermittent pollution due to galvanic industries, showing that moss bags are valid tools to evaluate the impact of point sources and the efficiency of depuration devices. E, F and G were three biomonitoring stations placed along an irrigation ditch. (Reference 2—with kind permission of Elsevier).
Low concentrations of Zn were accumulated at stations E and F. At station G, 330 mg kg–1 was measured after 19 days, after which values decreased to 200 mg kg–1. A suspected event of intermittent contamination, due to discharge of metals from the galvanic upstream, was registered. A similar episode occurred for Ni (not shown), but in this case, metal release measured from the moss started later.
When moss bags stations are placed in several watercourses, data can be processed by multivariate data analysis software, providing a numerical classification of elements and sites, which allows specific pollution patterns to be revealed.3,4 The dendrogram in Figure 2 gives an example.

Figure 2. Dendrogram of the contamination factors in seven watercourses of NE Italy. Transplants discriminated among (A) sites contaminated by Chrome; (B) and (C) sites where the highest contamination factors were reached for Manganese, Cobalt and other elements; (D) sites with intermediate contamination factors; (E) sites contaminated by Zinc and Antimony; (F) non-contaminated sites. Five groups of elements were also found: (1) Zn and Sb deriving from urban or industrial wastes; (2) Mn and Co from both wastes and soils (except Cd, which was not accumulated by mosses); (3) V, Fe, Pb and Al with geological origin or deriving from metallurgy; (4) Ni, Cr and Cu typically released by galvanic industries; and (5) Se, a trash cluster
When a biomonitoring study involves a wide—but homogeneous in geochemical terms—survey area with many stations, it is possible to calculate a background level for each element with statistical methods and then define a scale of naturality and alteration.4 The index we named Palladio was calibrated for 14 trace elements measured in 84 moss bags placed along seven rivers of the Bacchiglione basin in the Province of Vicenza and can be used to generate coloured maps of single-element or global pollution (see, as an example, Figure 3). This tool is now employed by the Public Authorities of the Province of Vicenza to control both main and secondary watercourses with 60 permanent stations.

Figure 3. Naturality-alteration map of the River Bacchiglione and some tributaries produced by the index Palladio for the element Co. (Reference 4—with kind permission of Springer Science and Business Media).
All analytical and operative costs being practically equal, a moss bag compared with a water sample provides much more representative information about the pollution at a monitoring site, owing to the time integration and the specificity for bio-available compounds. However, unfortunately, such advantages are not yet considered enough by the legislators in the field of water policy, both within Italy and the EU, since an official method has never been produced.
References
- P.L. Nimis, F. Fumagalli, A. Bizzotto, M. Codogno and N. Skert, “Bryophytes as indicators of trace metals pollution in the River Brenta (NE Italy)”, Sci. Total Environ. 286, 233–242 (2002). doi: 10.1016/S0048-9697(01)00979-2
- M. Cesa, A. Bizzotto, C. Ferraro, F. Fumagalli and P.L. Nimis, “Assessment of intermittent trace element pollution by moss bags”, Environ. Pollut. 144(3), 886–892 (2006). doi: 10.1016/j.envpol.2006.02.004
- M. Cesa, G. Azzalini, V. De Toffol, M. Fontanive, F. Fumagalli, P.L. Nimis and G. Riva, “Moss bags as indicators of trace metal contamination in pre-alpine streams”, Plant Biosyst. 143(1), 173–180 (2009). doi: 10.1080/11263500802709798
- M. Cesa, A. Bizzotto, C. Ferraro, F. Fumagalli and P.L. Nimis, “PALLADIO, an index of trace element alteration for the River Bacchiglione based on Rhynchostegium riparioides moss bags”, Water Air Soil Pollut. published online (2009). doi: 10.1007/s11270-009-0149-y
- M. Cesa, B.A Campisi, A. Bizzotto, C. Ferraro, F. Fumagalli and P.L. Nimis, “A factor influence study of trace element bioaccumulation in moss bags”, Arch. Environ. Contam. Toxicol. 55(3), 386–396 (2008). doi: 10.1007/s00244-007-9127-9
- M. Cesa, A. Bizzotto, C. Ferraro, F. Fumagalli and P.L. Nimis, “S.TR.E.A.M., System for trace element assessment with mosses. An equation to estimate mercury concentration in freshwaters”, Chemosphere 75, 858–865 (2009). doi: 10.1016/j.chemosphere.2009.01.074

