Klaus Hollemeyer,a Wolfgang Altmeyer,b Elmar Heinzlea and Christian Pitrac
aBiochemical Engineering Institute, Saarland University, Campus, D-66123 Saarbruecken, Germany
bGene-Facts GbR, Science Park 1, Stuhlsatzenhausweg 67, D-66123 Saarbruecken, Germany
cInstitute for Zoo and Wildlife Research, Postfach 601103, D-10252 Berlin, Germany
Introduction
In 2007 we introduced our method in Spectroscopy Europe1 describing the identification of furs by hair digest based matrix-assisted laser desorption/ionisation time of flight (MALDI-ToF) mass spectrometry (MS). It was shown that the so-called SIAM (Species Identification of Animals) method is a reliable exclusively protein-based technique for mammalian species identification. Besides the identification of suspicious furs according to the EU-ban of domestic cat and dog fur trade, which entered into being as from January 2009 and/or analogous further animal protection laws, quality checks of animal hair derived high priced clothing are routinely performed. Species attribution of unknown furs or wool from archaeological samples is a new application of this topic. The identification of archaeological hair samples is often difficult using classical methods like microscopy and/or polymerase-chain-reaction technique (PCR). Often the outer surface layers of the prehistoric hair (epi- and exocuticula) are damaged due to physical, chemical and/or microbial effects especially if stored under suboptimal conditions. These drawbacks make microscopic determinations often uncertain. Although there are examples known for the partial surviving of labile DNA in ancient hair samples, essential for the PCR identification technique, this nucleotide-based method often fails because of severe damage to the remaining DNA. Responsible for this are the same effects mentioned above, whereas fungal attacks to hair may even lead to exhausted shells, described as “ghost fibres”.2
Keratin protein molecules as the structural base of hair are more resistant to those environmental stress factors than DNA and may be conserved with minor chemical degradations even under suboptimal conditions thousands of years. The species determination of ancient furs was therefore a new challenge for the SIAM method to demonstrate its power of performance and to add a further application field.
The world-famous Oetzi (Ötzi, the Iceman) mummy
In 1991 a male human mummified body was found in a Tyrolean glacier with all his accoutrement around him. He was not buried, but died violently.3 By chance he was conserved in the ice and released after 5300 years as a unique witness from the Chalcolithic epoch, the last period of Neolithicum. Oetzi, as he was called in public, gave the chance to have a view into the everyday life in late Neolithicum revealing medical conditions of this body, his nutrition state and his technological state of art. Mechanical skills and botanical knowledge were studied as well as the quality and origin of his garments. No textiles were found but exclusively leather and fur made clothing. Answers to the socio-cultural state of his society were expected by species identification of his garments.4 In case of exclusively finding wild game as the origin of his leather and fur accoutrement it would have been likely that his society had no access to domesticated species therefore belonging to a more primitive hunter and gatherer society. However, in the case of identification of mainly domesticated species as the origin of his clothing, the more progressive agro-pastoral economy would have been favoured.
The enormous age, assumed under changing storage conditions, meant that microscopic determinations and PCR identification efforts of hair and fur led to uncertain identification results. Therefore, four samples of his garments, two of his coat (Ha 43/91/130 and Ha 6/91) one sample from his leggings (Ha 5/91) and one from his shoes (Ha 2/91) were investigated using the SIAM method for species identification.5
SIAM-method description
After reduction of inter- and intra-molecular disulphide bridges, without any clean-up and/or enrichment steps, small hair samples of water rinsed furs were digested by trypsin for two hours. The formed pool of cleaved peptides, stemming from various structural proteins of hair were measured by MALDI-ToF mass spectrometry and arranged according to their molecular weight-to-charge ratio (m/z). In this way, mass-intensity spectra (m/z-Int) of species-specific peptide patterns are generated. After data normalisation, mass-relative intensity spectra (m/z-Intrel,i) were calculated from these raw data and used for correlation distance similarity comparisons, a form of Euclidean distance, as a measure of spectral accordance of two mass spectra. Spectral comparisons of unknown samples were performed against spectral data of reference species stored in SIAM-data bases. Their results were ranked according to decreasing similarity. From correlation distance data, classical multidimensional scaling approaches were performed. The complex similarity relationships are shown by projection to two dimensions.
The method is based on the assumption that individuals from one species carry molecular variants of keratin that are different from those found in individuals from other species. Therefore, spectral similarities of tryptic keratin patterns from different species or higher taxonomic categories (i.e. genus, tribe, family) are decreasing with their taxonomic distance. In order to attain a correct identification it is crucial to consult a reliable database, namely one that guarantees that: (a) the reference specimen was taxonomically confirmed; (b) the same experimental procedure was applied for all samples; (c) additionally, most related species have distinct mass spectral patterns. The creation of corresponding reference libraries is likely to be a complex process that will involve cooperation among a diverse group of scientists and institutions.
Identification of the archaeological specimens was also supported by a combination of peptide mass fingerprint and collision-induced dissociation product ion MS of selected peptides after tryptic digestion. MS spectra and their resulting MS/MS fragmentation spectra were submitted to a MASCOT MS/MS ion search against the publicly available NCBI non-redundant protein database (National Institutes of Health, Bethesda, MD) to identify peptide sequences that match identically to extant related organisms of known sequence. However, care must be taken when assigning the questioned sequence to the species with the highest similarity, because this approach does not provide any information, if the unknown species is not present in the database as a reference. This may be a problem for exotic species, while many hair keratins from domesticated mammals are characterized.
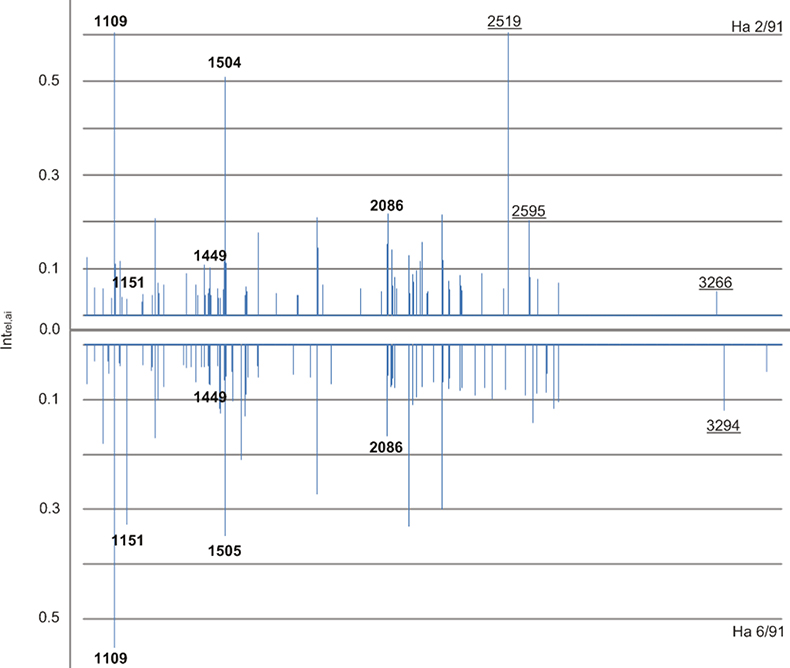
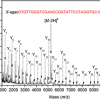
Figure 1. Two normalised mass-intensity spectra from Oetzi samples Ha 2/91 and down-mirrored Ha 6/91 in the range of m/z 1000 to 3000 Da. Guidance masses are given in bold and diagnostic peaks are underlined.
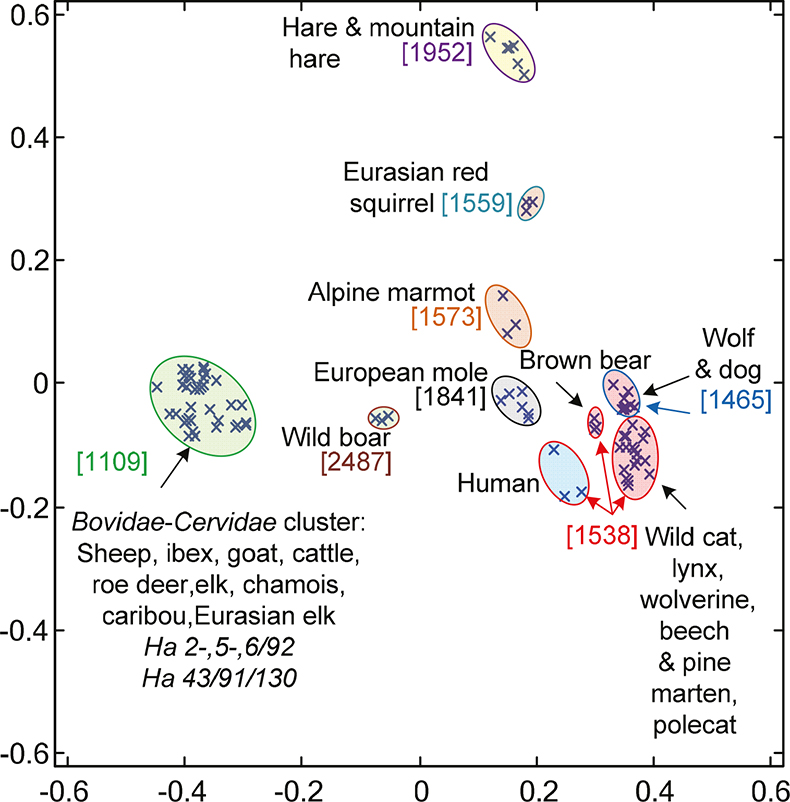
Figure 2. 2-D-visualisation of the two main factors resulting from classical multidimensional scaling of correlation distances from peptide mass spectra among mammalian species and the four archaeological Oetzi samples marked as Ha 2-,5-,6/91 and Ha 43/130/91. Species from the Alpine surroundings are given. The coloured circles represent tested individuals from distinct zoological orders: green for Artiodactyla, blue for Primates, red for Carnivora, yellow for Lagomorpha, grey for Soricomorpha and light brown for Rodentia. Coloured numbers in square brackets stand for guidance masses. The scopes of the leading masses are indicated by the same colour of the circle lines.
Instrumentation
MALDI-ToF mass spectrometry
Analyses were performed on a 4800 TOF/TOF Analyzer mass spectrometer (Applied Biosystems, Darmstadt, Germany) in positive reflector mode. The system uses a pulsed 200 Hz solid state Nd:Yag laser with a wavelength of 355 nm. Laser energy was set to 2560 units for standards and 3000 units for real samples. Source 1 voltage was set to 20 kV with a grid voltage of 16 kV. Reflector detector voltage was 2.19 kV. Spectra of standard peptides used for wide range calibration covering from 0.8kDa to 4 kDa were measured with a delay time of 600 ns. One single mass spectrum was formed from 20 sub-spectra per spot using 25 accepted laser shots each. From the six standard peptides exclusively monoisotopic ions were used and calculated with a minimum signal-to-noise ratio of 20 and a resolution better than 10,000. Mass tolerance was set to ±0.2 Da with maximum outlier of 5 ppm. Accepted calibration settings were used to measure real sample spectra in the range of 1–3.5 kDa with a minimum signal-to-noise range of 10 and a resolution better than 8000.
MALDI-ToF/ToF–tandem mass spectrometry
The precursor ions in MS/MS studies were monoisotopic with four decimal places. Mass tolerance was set to ±0.2 Da, source voltage to 8 kV with a grid voltage of 7.361 kV and a laser power of 4500 units. Air was chosen as collision gas. The CID lens was set to 4 kV and the collision cell to 7 kV. The potential difference between the source acceleration voltage and the collision cell was set to 2 kV. MALDI-TOF/TOF-MS/MS spectra were measured in reflector positive ion mode. Glu1-fibrinopeptide B was taken for calibration with its theoretical monoisotopic mass-to-charge ratio (m/z) 1570.6758, from which 50 sub spectra with 100 shots each were accumulated for one MS/MS spectrum. Four of five listed dissociation peptide ions of the precursor ion had to be found for calibration with a signal-to-noise ratio (S/N) better than 50. These instrument parameters were also used for precursor ions of real samples.
MS and combined MS and MS/MS searches were performed with the mummy’s samples using the automatic routines from GPS-Explorer software (Applied Biosystems, Darmstadt, Germany; version 3.6) and MASCOT search engine (Matrix Science Inc., Boston, MA, USA) (www.matrixscience.com). For MS searches no protein mass or origin species restrictions were set. Peptide mass tolerance was 50 ppm with one missed cleavage. Carboxymethylation of cysteine and oxidation of methionine were chosen as variable modifications. For MS/MS measurements, precursor ion tolerance was set to 200 ppm and MS/MS fragmentation tolerances to 0.3 Da.
MS and combined MS and MS/MS searches were performed using the National Center for Biotechnology Information database (NCBI, Bethesda, MD, USA; homepage [www.ncbi.nlm.nih.gov)]. 95% significance level (p < 0.05) was chosen based on Mowse score calculations. For MS searches the Mowse score had to exceed 67 and 80 for combined MS and MS/MS searches, respectively.
Results
Age-related deviations in the iceman’s mass spectra
Measurements of the mummy samples resulted in mass spectra showing a moderately reduced number of detected peptides compared to those of recent samples. Progressed protein decay in the mummy’s samples is causal for the reduced numbers of peaks. Beside OH–.-radicals other reactive oxygen species (ROS) are known to attack the backbones and side chains of proteins. In the presence of water, O2 and O2–. -radicals, the protein backbone breaks after several amino acid residues. Moreover, the trypsin cleavage sites arginine and lysine, essential for the used method, may be derivatised and therefore no more cleavable by trypsin. Other amino acid side chains may also undergo derivatisation leading to altered derivatives. The reduced total numbers of peaks in the spectra of the archaeological samples were expected to enlarge the correlation distances in comparison with reference species.
Diagnostic peptide ions and guidance masses
The mummy’s spectra showed a series of tryptic peptide ions that were identified earlier as specific for most artiodactyl species, with basic characteristic diagnostic ions m/z 1151, 1449, 1504 and 2086 (Figure 1). Additionally, the guidance mass m/z 1109 was found as a general indicator for the Bovidae–Cervidae cluster. These masses were detected in all four samples while no characteristic ions of other orders were observed. Additionally, ions m/z 3294, 2519 and 2595 were found that are characteristic for sheep and cattle. m/z 3266 exclusively occurred in combination with m/z 2519 and 2595 indicative of cattle. The diagnostic peptide ion table for Artiodactyla (Table 1) was used to exclude species disagreeing in their diagnostic peptides sets. The presence of m/z 3294 but missing single m/z 3266 was pointing to sheep for Ha 43/91/130, Ha 6/91 and Ha 5/91, while Ha 2/91 was identified as cattle using m/z 2519, 2595 and 3266 in combination.
Table 1. Diagnostic peaks from selected species from the artiodactyls and their counterparts in the archaeological samples. m/z values in bold are used as diagnostic peaks for the Artiodactyla. Additionally, m/z 1109 marked with (#) was used as a guidance mass for the Bovidae–Cervidae cluster. Members of this cluster are marked in pale red. Diagnostic peak masses underlined were used as precursor ions for species identification. m/z 2622 marked with (*) was only identified as diagnostic peak using MS/MS analysis.
|
| Diagnostic peak ions (m/z) | |||||||||||||||||
Sample/reference | Zoological name | 1109# | 1151 | 1449 | 1452 | 1458 | 1504 | 1708 | 1776 | 2031 | 2086 | 2214 | 2487 | 2519 | 2583 | 2595 | 2622* | 3266 | 3294 |
Ha 43/91/130 |
| ● | ● | ● |
|
| ● |
|
|
| ● |
|
|
|
|
| ● |
| ● |
Ha 6/91 |
| ● | ● | ● |
|
| ● |
|
|
| ● |
|
|
|
|
| ● |
| ● |
Ha 2/91 |
| ● | ● | ● |
|
| ● |
|
|
| ● |
|
| ● |
| ● |
|
|
|
Ha 5/91 |
| ● | ● | ● |
|
| ● |
|
|
| ● |
|
|
|
|
| ● |
| ● |
Sheep | Ovis aries | ● | ● | ● |
|
| ● |
|
|
| ● |
|
|
|
|
| ● |
| ● |
Goat | Capra hircus | ● | ● | ● |
|
| ● |
|
|
| ● |
|
|
|
|
| ● | ● |
|
Ibex | Capra ibex | ● | ● | ● |
|
| ● |
| ● |
| ● | ● |
|
|
|
|
|
|
|
Cattle | Bos taurus | ● | ● | ● | ● |
| ● |
|
|
| ● |
|
| ● |
| ● |
| ● |
|
Yak | Bos grunniens | ● | ● | ● |
|
| ● |
|
|
| ● |
|
| ● |
|
|
|
|
|
Elk | Cervus elaphus | ● |
| ● |
|
| ● |
|
|
| ● |
|
| ● |
|
|
|
|
|
Western roe deer | Capreolus capreolus | ● |
| ● |
| ● | ● |
|
|
| ● |
|
|
|
| ● |
|
|
|
Chamois | Rupicapra rupicapra | ● | ● | ● |
|
| ● |
|
|
| ● |
|
|
|
|
| ● |
|
|
Wild boar | Sus scofa |
|
|
|
|
| ● |
|
|
| ● |
| ● |
|
|
|
|
|
|
European elk | Alces alces | ● |
| ● |
|
| ● |
|
| ● | ● |
|
| ● |
|
|
|
|
|
Caribou | Rangifer tarandus | ● |
| ● |
|
| ● | ● |
|
|
|
|
| ● |
|
|
|
|
|
Camel | Camelus camelus |
|
| ● | ● |
| ● |
|
|
| ● |
|
|
| ● |
|
|
|
|
Classical multidimensional scaling
In 2-D-visualisation, the normalised mass spectra from Oetzi samples showed highest similarities to sheep, goat and cattle reference species merging into a distinct Bovidae–Cervidae cluster (Figure 1) with guidance mass m/z 1109. Other species clusters from different families and/or orders could be excluded from potential identity with the Oetzi samples by their large distances from the Bovidae–Cervidae cluster or by different guidance mass for wild boar (m/z 2487), respectively.
Combined MS and MS/MS data base search
The search for host proteins for the tryptic digests of the mummy’s samples led to four bovine keratins for Ha 2/91 all highly significant when using m/z 2519 as the sole precursor ion. However, keratins from sheep and goat did not exceed the significance threshold with one exception for wool keratin from sheep lying near to it (Table 2). The other three samples showed significant results with sheep and goat keratins when using m/z 1109, 1504, 2519 and 2595 as precursor ions. Sheep and goat keratins only differ slightly making it difficult to discriminate between them even by combined MS and MS/MS search.
Table 2. Matching results of combined MS and MS/MS searches using spectral data from the four mummy samples together with m/z 2519 as single precursor ion. NCBI data base was used with MASCOT search engine. Selected Mowse score significance level is >80 for p < 0.05. Significant results are given in bold. Maximum number of hits was set to 20. Proteins not found within the 20 best were set to “nd”.
| Mowse scores | |||||
Protein | Keratin species | Species | Ha 2/92 | Ha 43/91/130 | Ha 6/91 | Ha 5/91 |
Hypothetical protein LOC 618455 | 33B | Cattle | 175 | nd | 68 | nd |
Hypothetical protein LOC 618453 | 31 | Cattle | 166 | nd | nd | nd |
Hypothetical protein LOC 539597 | 33A | Cattle | 166 | nd | 74 | nd |
Hair keratin A1 | 34 | Cattle | 162 | nd | nd | nd |
Keratin Typ1, microfibrillar 48 kDa, Component 8C-1 | K1M1 | Sheep | 74 | nd | 62 | 56 |
Wool keratin |
| Sheep | 87 | nd | 65 | 57 |
Keratin type 1, microfibrillar 47.6 kDa | K1M2 | Sheep | nd | nd | 57 | nd |
Type 1 wool | 31 | Sheep | nd | nd | 53 | 61 |
Hair acid keratin |
| Goat | 54 | nd | 61 | nd |
Conclusions
The different determination steps led to consistent results for the identification of the four Oetzi samples. Ha 2/91 is undoubtedly from cattle, while the other three samples originated from sheep. These findings of domesticated species as being the origin of all four samples indicate the principle access to that source of clothing and alimentation. An agro-pastoral society can be taken as a socio-cultural basis making Oetzi’s society more progressive than previously assumed. Further SIAM investigations of other parts of his clothing have been initiated and may deliver a more complete overview of the spectrum of species origin available for his accoutrement.
References
- K. Hollemeyer, W. Altmeyer and E. Heinzle, Spectrosc. Europe 19(2), 8 (2007). https://www.spectroscopyeurope.com/article/identification-furs-domestic-dog-raccoon-dog-rabbit-and-domestic-cat-hair-analysis-using
- A.S. Wilson, H.J. Dodson, R.C. Janaway, A.M. Pollard and D.J. Tobin, Cutaneous Biol. 157, 450 (2007).
- K. Spindler, The Man in the Ice. Weidenfeld & Nicholsson, London (1994).
- Sherwatt, “The transformation of early agrarian Europe: the later Neolithic and Copper ages 4500–2500 BC”, in The Oxford Illustrated Prehistoric of Europe, Ed by B. Cunliffe. Oxford University Press, Oxford (1994).
- K. Hollemeyer, W. Altmeyer, E. Heinzle and C. Pitra, Rapid Commun. Mass Spectrom. 22, 2751 (2008). doi: https://doi.org/10.1002/rcm.3679