Manoj K. Tiwari
Synchrotrons Utilization Section, Raja Ramanna Centre for Advanced Technology, Indore 452013, Madhya Pradesh, India. E-mail: [email protected]
DOI: https://doi.org/10.1255/sew.2018.a1
© 2018 Spectroscopy Europe
Introduction
Nanomaterials find widespread applications in many fields of science and nanotechnology, especially as catalysts in the chemical, bio-nanotechnology, nano-electronics and pharmaceutical industries. Understanding the physical and chemical properties of nanoscale materials is important, not only because of the fascinating nature of the subject, but also due to their potential applicability in almost every branch of science and technology. Nanostructured materials offer interesting properties, because at the atomic or molecular scale, the physical properties of a material become size dependent due to the quantum confinement and surface states effects.
Similarly, patterned nanostructures are very important in fabricating novel electronic, magnetic and photonic devices. For example, molecular printing of nanoparticles is highlighted as a method for creating an organised precursor structure on a substrate surface for locating nanowires and carbon nanotubes. In all the examples, the ability to control the particle size distribution and surface morphology of the nanoparticles is of crucial importance, both from the point of view of fundamental understanding and of the tremendous number of high-tech industrial applications in the areas of dye-sensitised solar cells, smart displays and glass windows, chemical, gas and bio sensors, lithium batteries, super capacitors etc.1–3
Some common X-ray techniques used for nanomaterials characterisation
X-ray reflectivity
X-ray reflectivity (XRR) is a widely used characterisation technique to obtain micro-structural details of a nanostructured thin film medium (e.g. thickness, interface roughness, density variation etc). The technique offers high accuracy for the determination of the thickness of a thin medium. The XRR technique, however, has the limitation that it does not provide any element-specific information. In addition, the technique suffers from a serious limitation in its applicability to analyse ultrathin layers of thickness in the sub-nanometre range, or structures of very large thickness (>100 nm), as well as non-reflecting thin film systems.4
X-ray fluorescence
X-ray fluorescence (XRF) spectroscopy is one of the simplest and most widely used techniques for the non-destructive multielement analysis of materials. Over the past several years the technique has seen a remarkable progress and proved its applicability to a variety of fields such as archaeology, environment, geology and materials science.5 Apart from the research applications, the technique has also found success in industry, especially in maintaining the quality of ultra-pure grade chemicals, reagents and products. In conventional XRF, the element detection sensitivities are largely limited to the µg g–1 (ppm) range; mainly because of the large spectral background produced by the Compton scattered X-rays from the specimen.
Total reflection X-ray fluorescence (TXRF)
TXRF is another variant of the XRF technique, where the complexity of the Compton spectral background is eliminated to a great extent. This is due to the high reflectivity of the flat surface and low penetration depth of the primary X-ray beam in the substrate material, on which the incident X-rays are allowed to impinge at glancing incidence angles. All these features improve the detection sensitivities of TXRF technique by two or three orders of magnitude or better compared to conventional XRF: typically in the range of parts per billion (ppb) for most elements.6
Grazing incidence X-ray fluorescence (GIXRF)
One of the variants of TXRF, often referred as fluorescence-assisted X-ray standing wave (XSW) is a powerful and versatile tool to unfold depth-resolved physical and chemical properties of nanostructured materials, as it combines the features of both X-ray reflectivity (XRR) and XRF techniques. Under the condition of total external reflection of X-rays on a mirror surface or Bragg reflection from a multilayer structure, the incoming and reflected beams interfere and form an XSW field on top of the mirror surface. This XSW field also extends below the mirror surface to a certain depth. It can be used to excite impurity elements that are embedded inside a thin film medium. Enhanced fluorescence radiation is emitted from those parts of the sample volume that present at the locations of XSW field antinodes. This variant of the XRF technique is referred as grazing incidence X-ray fluorescence (GIXRF). The technique offers high accuracy for the determination of the density variation in a thin film medium. The GIXRF analysis not only provides dimensional visualisation for nanostructured materials, but it also offers depth-resolved localisation for a foreign impurity element inside a thin film medium.7,8 A few research groups have recently shown that GIXRF measurements can be successfully used for the determination of the average size of nanoparticles dispersed over a large surface area on a reflecting surface as well as for those embedded in a polymer matrix.9 In recent work, we have shown that it is possible to infer detailed information on depth-resolved chemical speciation and the electronic nature of a thin film structure if near-edge X-ray absorption measurements are carried out in combination with the XSW investigations.10
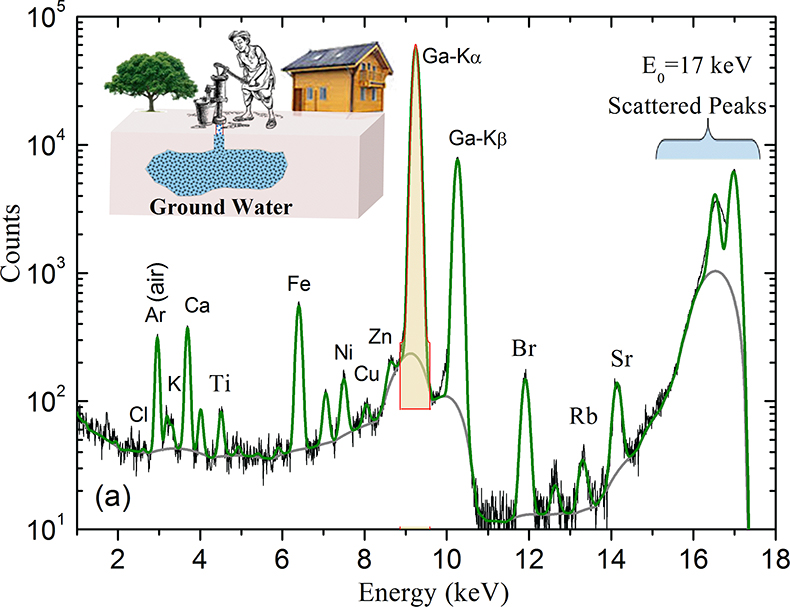
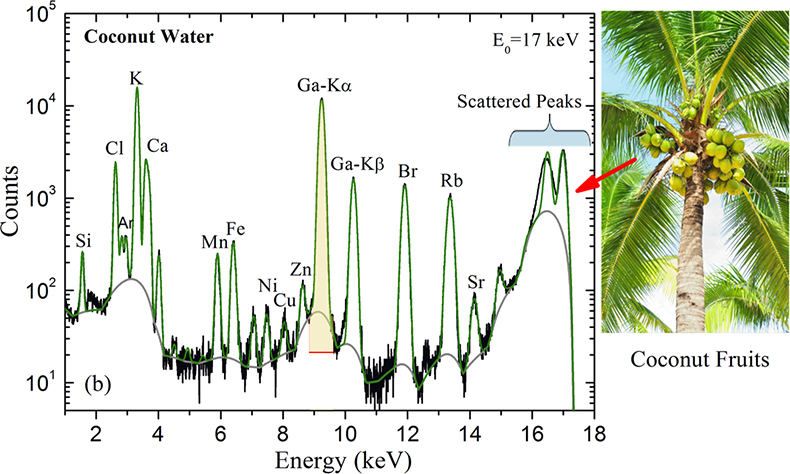
Figure 1. Measured TXRF spectrum of ground water (a) and coconut fruit water (b) at monochromatic X-ray energy of E0 = 17 keV. Ga (35 ppm) was used as an internal standard during TXRF quantification. Solid back and green lines, respectively, are the experimental and fitted data whereas grey line represents a good estimation of the spectral background.
Environmental applications
TXRF measurements were carried out to determine the presence of various trace elements in ground water and coconut water samples. For this, ~10 µL volume of two water specimens were pipetted onto a cleaned quartz glass substrate after adding Ga as an internal standard element (35 ppm) and without employing any dilution procedure. The dried residue of the water was then directly employed for TXRF excitation. Figures 1(a) and 1(b) illustrate the measured TXRF spectra of the ground water and coconut water samples, respectively. By comparing the two spectra, it can be seen that coconut water contains several trace elements in larger amounts than ground water. It is known that coconut water provides a rich dietary source of cytokinins and plant hormones that offer anti-cancer, anti-aging and anti-thrombolytic benefits in humans. Table 1 summarises and compares the determined concentrations of various trace elements present in the coconut and ground water samples.
Table 1. Determined concentrations of various trace elements in the water and coconut water. All quantities are in (mg L–1), (1 mg L–1 = 1 ppm).
Element | Ground water | Coconut fruit water | WHO guidelines |
Cl | 0.04 | 265 | ≤5 |
K | 0.37 | 1367 | Not defineda |
Ca | 3.0 | 68.0 | ≤100, (100–300 may change taste of water) |
Ti | 0.17 | — |
|
V | — | 0.03 |
|
Cr | 0.003 | 0.023 | ≤0.05 |
Mn | 0.012 | 1.7 | ≤0.4 |
Fe | 0.55 | 1.8 | 0.5–50 |
Ni | 0.08 | 0.158 | ≤0.07 |
Cu | 0.026 | 0.09 | ≤2 |
Zn | 0.03 | 0.26 | 0.01–0.05 |
Ga (internal standard) | 36.0 | 36.0 | — |
Br | 0.07 | 3.6 | ≤0.05 |
Rb | 1 ppb | 2455 ppb | — |
Sr | 0.06 | 0.2 | — |
arecommended daily requirement is >3000 mg
Characterisation of nanomaterials
Nanostructured thin films
As discussed above, angle dependent TXRF, often referred as GIXRF, can be successfully used to evaluate the microstructural properties of flat optical surfaces and thin layered materials. In particular, the technique is very effective in determining structures of nanolayers deposited on flat polished Si wafers. With recent advancements in the thin-film growth technologies, considerable interest has been focused on the fabrication of superior-quality, thin, nano-structured materials that have better surface–interface properties and improved layer thickness homogeneity. Combined X-ray reflectivity and GIXRF measurements allow structural parameters (e.g. thickness, surface roughness, film density) to be determined as well as depth-resolved distribution of unwanted foreign impurity elements, if any, embedded inside the thin film medium.11 Figure 2 shows a computed XRR pattern for a CuO (4 nm)/Cu (30 nm) bilayer thin film medium, deposited on a Si substrate. The lower frequency fringe oscillations (Kiessig fringes) in the XRR pattern give structural information on the thin CuO film medium, whereas high frequency oscillations provide structural information of the thick Cu film medium. The XRR-GIXRF measurements can be reliably used to analyse a heterogeneous thin film structure comprising of different surface and interface properties.
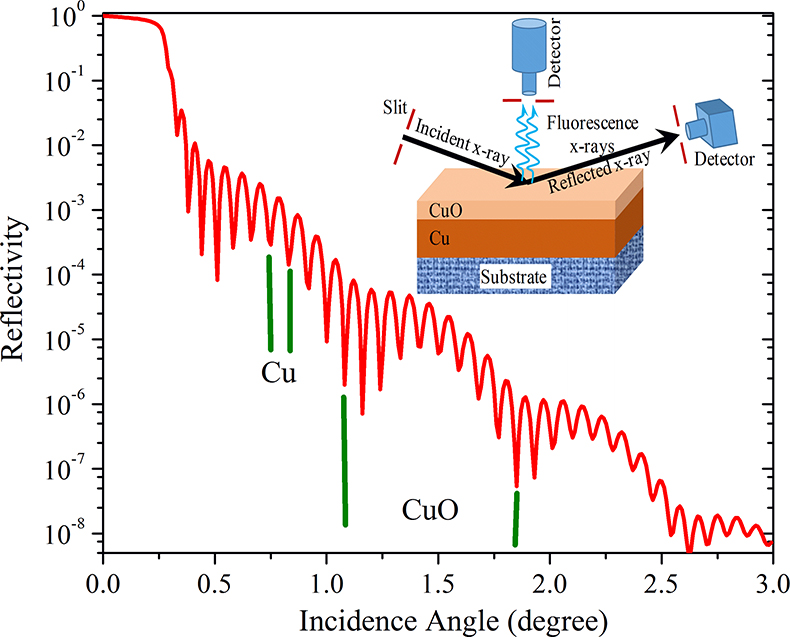
Figure 2. Computed X-ray reflectivity pattern of a CuO (4 nm)/Cu (30 nm) bilayer structure, deposited on a Si substrate surface. The computations were performed using the GUI-CATGIXRF11 program assuming incident X-ray energy of 12 keV.
Analysis of nanoparticles
The nature of dispersion of nanoparticles on a flat surface (see Figure 3) is governed by many complex short-range forces. Depending upon the surface chemistry and available cohesive and adhesive forces between different particles as well as between particle and substrate, the dispersion of nanoparticles on a flat surface usually follows a complex distribution profile. It might be monodispersive in nature or may follow a complex distribution of particles in the form of agglomerations. The quantitative analysis of such complex nanostructured materials is very challenging, but still a largely unexplored issue. Currently available surface characterisation techniques are not widely suitable for the morphological analysis of such complex nanostructured materials. Below, it has been shown how GIXRF measurements can be employed as a sensitive probe to characterise the nature of dispersion of nanoparticles on a flat surface.12
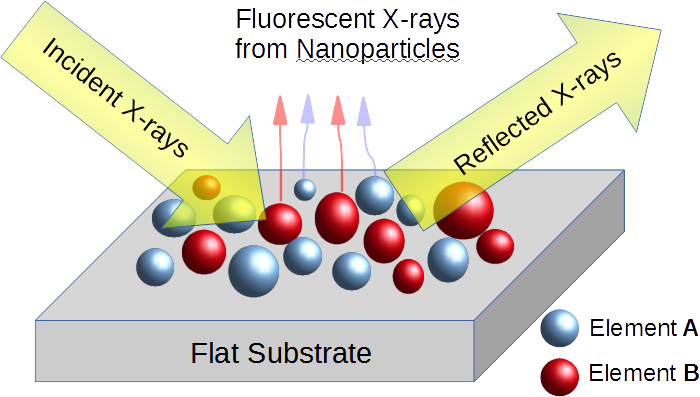
Figure 3. A schematic illustration showing the distribution of nanoparticles of different elements on top of a flat surface.
Determination of size and shape of the nanoparticles
To demonstrate the capability of the GIXRF technique for the determination of size distribution profile of the nanoparticles on a flat surface,13 numerical simulations have been carried out. During the GIXRF computations, Au nanoparticles of an average diameter ~30 nm and comprising of different particle size distribution profiles has been considered. Figures 4(a), (b) and (c) show the computed GIXRF profiles for the Au nanospheres at 15.0 keV incident X-ray energy assuming different r.m.s. variations (s) in the particle size distribution (2 nm, 8 nm and 12 nm, respectively). From Figure 4, it can be seen that the GIXRF profile undergoes a systematic variation if the r.m.s. value of the Au nanospheres changes from 2 nm to 12 nm. The Au-La intensity modulations in the GIXRF profiles below the critical angle (qC ~ 0.12°) change rapidly and merge together as the r.m.s. variation in the particle size is increased. In the insets of Figures 4(a), (b) and (c), distribution profiles of the Au nanoparticle as a function of their size (normalised frequency vs particle size) are shown.
Numerical simulations have also been carried out to determine how effectively GIXRF measurements can be used to distinguish different shapes of nanoparticles. To maintain a consistency in the interpretation with respect to previous results, similar sizes of the Au nanoparticles (average diameter ~30 nm) were considered. During the numerical simulations, different shapes of nanoparticles were considered. Figure 4(d) represents a simulated GIXRF profile for spherical nanoparticles, whereas Figure 4(e) depicts a simulated GIXRF profile for the cylindrical shape (i.e. a nanorod). In both the cases, a r.m.s. variation in the particle size distribution of s ~ 2 nm has been assumed. The calculations were performed considering an incident X-ray energy of 15 keV. By comparing Figures 4(d) and 4(e), it can be seen that the Au-La fluorescence yield shows strong variations below qC, when the shape of the nanoparticles changes from spherical to cylindrical. These results clearly show that the shape parameter considerably modulates the GIXRF profile of a nanoparticle. Such measurements can be successfully employed to distinguish different shapes of metal nanoparticles (e.g. nanosphere, nanorod etc.).
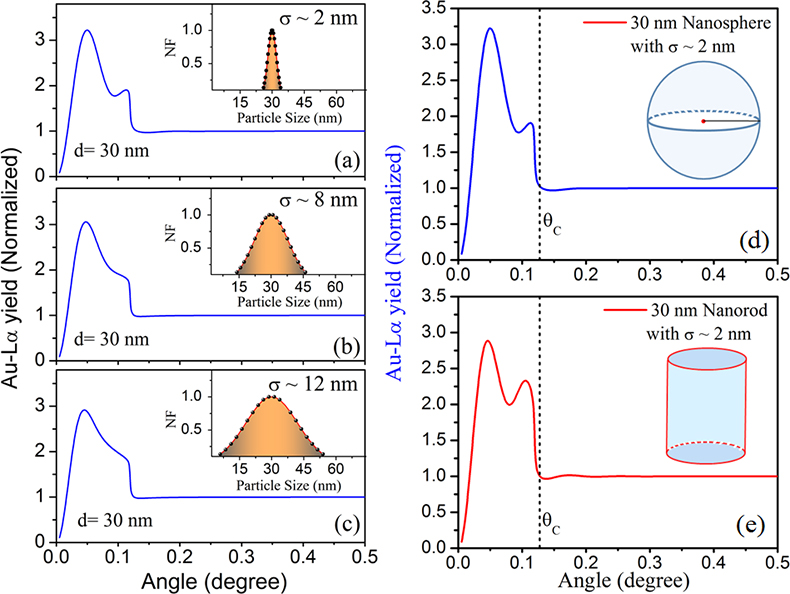
Figure 4. Computed Au-Lα fluorescence profiles for the Au nanospheres dispersed on the Si surface at incident X-ray energy of 15.0 keV. The computations were carried out assuming an average particle size of ~30 nm and considering different r.m.s. variations (σ) in the particle size distribution (a) σ = 2 nm, (b) σ = 8 nm and (c) σ = 12 nm. Computations were also carried out to account the effect of different shapes of the nanoparticles. (d) Nano-sphere of diameter ~30 nm, (e) nanorod (height = 30 nm). The figure is reproduced with permission from Reference 13, Copyright © 2017 John Wiley & Sons, Ltd.
GIXRF measurements also allow one to evaluate whether the distribution of the nanoparticles on top of a substrate surface exhibits monodispersion or whether agglomerations form.14 Figure 5(a) shows a recorded GIXRF profile for the monodispersed distribution of Fe nanoparticles of average diameter ~20 ± 1 nm on top of a Si substrate. Figure 5(b) demonstrates measured a GIXRF profile for an agglomerated distribution of similar Fe nanoparticles on the Si substrate surface. The insets in Figure 5 show SEM pictures in the respective cases. It can be seen here that the GIXRF measurements are fairly sensitive and can distinguish the nature of the distribution of nanoparticles on top of a substrate surface.
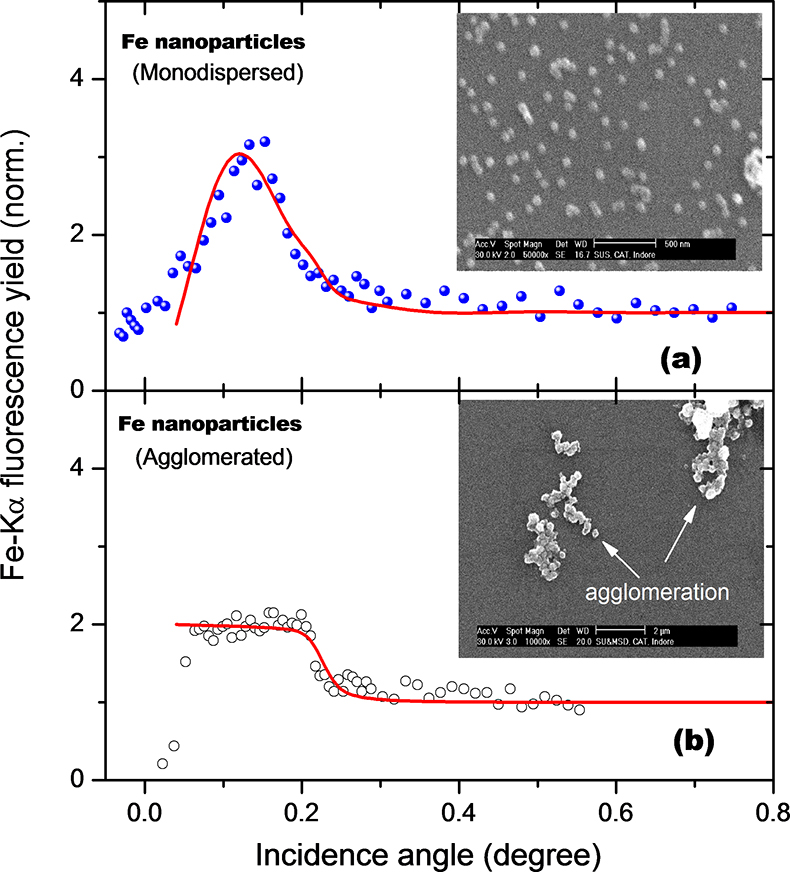
Figure 5. (a) The measured and fitted GIXRF profiles for different distribution forms of Fe nanoparticles on a Si substrate. (a) Monodispersed distribution of Fe nanoparticles and (b) agglomerated distribution of Fe nanoparticles. Scattered points show measured experimental data whereas solid red lines are the fitted GIXRF curves. The insets show SEM images of the Fe particles in each case. Reproduced from Reference 14 with the permission of AIP Publishing.
Conclusions
It has been shown that XRR and GIXRF are powerful and complementary tools to characterise depth-resolved, surface–interface properties of nanostructured materials deposited on top of a flat smooth surface. The technique allows one directly to estimate average particle size, particle shape, nature of dispersion of nanoparticles on a substrate surface. Element specificity is another potential feature of the GIXRF method. A single measurement is sufficient to determine the average size of the nanoparticles over large surface areas, obviating the need to perform several measurements over small regions of a specimen, which is commonly required in other conventional probes. With respect to its inherent nature, the technique can be successfully employed to analyse surface morphology of a variety of nanostructured materials, dispersed on top of a polished surface or embedded inside the bulk matrix, a few nanometres below the surface.
Acknowledgements
The author would like to thank Dr A.K. Sinha and Sh. Gangadhar Das, Synchrotrons Utilization Section, for the fruitful discussions and suggestions during preparation of the article.
References
- J.D. Major, M. Al Turkestani, L. Bowen, M. Brossard, C. Li, P. Lagoudakis, S.J. Pennycook, L.J. Phillips, R.E. Treharne and K. Durose, “In-depth analysis of chloride treatments for thin-film CdTe solar cells”, Nature Commun. 7, 13231 (2017). doi: https://doi.org/10.1038/ncomms13231
- C. Antoniak, J. Lindner, M. Spasova, D. Sudfeld, M. Acet, M. Farle, K. Fauth, U. Wiedwald, H.-G. Boyen, P. Ziemann, F. Wilhelm, A. Rogalev and S. Sun, “Enhanced orbital magnetism in Fe50Pt50 nanoparticles”, Phys. Rev. Lett. 97, 117201 (2006). doi: https://doi.org/10.1103/PhysRevLett.97.117201
- B.R. Cuenya, “Synthesis and catalytic properties of metal nanoparticles: Size, shape, support, composition, and oxidation state effects”, Thin Solid Films 518, 3127–3150 (2010). doi: https://doi.org/10.1016/j.tsf.2010.01.018
- M.K. Tiwari, G.S. Lodha and K.J.S. Sawhney, “Applications of the ‘CATGIXRF’ computer program to the grazing incidence X-ray fluorescence and X-ray reflectivity characterization of thin films and surfaces”, X-Ray Spectrom. 39, 127–134 (2010). doi: https://doi.org/10.1002/xrs.1215
- R.E. Van Grieken, Handbook of X-ray Spectrometry, 2nd Edn. Marcel Dekker, New York, pp. 433–498 (2002).
- M.K. Tiwari, A.K. Singh and K.J.S. Sawhney, “Sample preparation for evaluation of detection limits in X-ray fluorescence spectrometry”, Anal. Sci. 21, 143–147 (2005). doi: https://doi.org/10.2116/analsci.21.143
- G. Das, S.R. Kane, A. Khooha, A.K. Singh and M.K. Tiwari, “Simultaneous measurements of X-ray reflectivity and grazing incidence fluorescence at BL-16 beamline of Indus-2”, Rev. Sci. Instrum. 86, 055102 (2015). doi: https://doi.org/10.1063/1.4919557
- G. Das, S.R. Kane, A. Khooha, A.K. Singh and M.K. Tiwari, “Exploring interface morphology of a deeply buried layer in periodic multilayer”, Appl. Phys. Lett. 108, 263109 (2016). doi: https://doi.org/10.1063/1.4954710
- M. Brücher, M. Chakif, E.L. Gurevich and R. Hergenröder, “Polydisperse NiTi nanoparticles investigated by X-ray standing waves and electron microscopy—A comparative study”, Spectrochim. Acta B 98, 60–64 (2014). doi: https://doi.org/10.1016/j.sab.2014.05.004
- G. Das, A.G. Karydas, H. Ghosh, M. Czyzycki, A. Migliori and M.K. Tiwari, “Depth-resolved chemical speciation of a W-B4C multilayer structure”, Phys. Rev. B 96, 155444 (2017). doi: https://doi.org/10.1103/PhysRevB.96.155444
- M.K. Tiwari and G. Das, “An interactive graphical user interface (GUI) for the CATGIXRF program – for microstructural evaluation of thin film and impurity doped surfaces”, X-Ray Spectrom. 45, 212–219 (2016). doi: https://doi.org/10.1002/xrs.2692
- M.K. Tiwari, K.J.S. Sawhney, T.L. Lee, S.G. Alcock and G.S. Lodha, “Probing the average size of self-assembled metal nanoparticles using x-ray standing waves”, Phys. Rev. B 80, 035434 (2009). doi: https://doi.org/10.1103/PhysRevB.80.035434
- G. Das, A. Khooha, A.K. Singh and M.K. Tiwari, “Probing nanostructured materials using X-ray fluorescence analysis”, X-Ray Spectrom. 46, 448–453 (2017). doi: https://doi.org/10.1002/xrs.2777
- M.K. Tiwari, G.M. Bhalerao, M. Babu, A.K. Sinha and C. Mukherjee, “Investigation of metal nanoparticles on a Si surface using an x-ray standing wave field”, J. Appl. Phys. 103, 054311 (2008). doi: https://doi.org/10.1063/1.2885346