Luisa Mannina,a,b Anatoli P. Sobolevb and Annalaura Segreb
aUniversity of Molise, Faculty of Agriculture, 86100 Campobasso, Italy
bInstitute of Chemical Methodologies, CNR, 00016 Monterotondo Staz., Rome, Italy
Introduction
Nuclear Magnetic Resonance (NMR) is a branch of spectroscopy that is based on the fact that many atomic nuclei may be oriented by a strong magnetic field and will absorb radiofrequency radiation at characteristic frequencies. The parameters that can be measured on the resulting spectral lines (line positions, intensities, line-widths, multiplicities and transients in time-dependent experiments) can be interpreted in terms of molecular structure, conformation, molecular motion and other rate processes. To the chemist, the usefulness of NMR stems in large measure from the finding that any given isotope (e.g. 1H, 13C, 31P …) in a different chemical environment gives rise to distinct chemically-shifted spectral lines. Therefore, it is possible to observe a specific isotope in a particular environment even in complex structures, both in solution and in the solid state. Different NMR experiments and equipment, such as high-resolution NMR, low-resolution NMR and Magnetic Resonance Imaging, yield different information. With high-resolution NMR one can perform both qualitative and quantitative analyses of samples in solution, which can be used for structural studies and compositional analyses.
Food chemistry
To assess the role of NMR in food chemistry we must know which specific problem it has to solve, how conclusive is the evidence that derives from the NMR investigation and how it compares to other methods that can be brought to bear on the same problems. In the published literature, many NMR studies using various NMR techniques have been reported on different types of food and drinks which include wine, olive oil, coffee, fruit juices, tomatoes, milk, meat, egg, starch granules and flour. In this article, we will show the contributions of high-resolution NMR to the characterisation of olive oil.1
NMR practical considerations
Magnetic field
A major goal in the analytical evaluation of the composition of any food is to undertake the analysis without the need for any extraction or separation. A typical food product will contain many species present in a wide range of concentrations, which means that components present in ppm must be detected in the presence of other species at high concentration. This characterisation can be performed by NMR spectroscopy provided that the spectrometer has certain performance characteristics. A key one is strength of the magnetic field, since signal separation is proportional to the field intensity. Moreover, NMR is intrinsically a low-sensitivity method, in which the signal intensity is dependent on the magnetic field strength to the power 3/2. Therefore for optimum performance use of a high field strength magnet is necessary. The general rule is “the higher, the better”.
Dynamic range and detection limits
The measured electrical NMR (free induction decay, FID) signal collected as a function of time must be converted into digital form prior to performing a numerical Fourier transform in order to obtain the spectrum in the frequency domain. The analogue-to-digital converter (ADC) samples a voltage and gives an output as a binary number proportional to it (typical word lengths for NMR are 12–16 bits). It is advantageous for the ADC to represent the signal with the largest possible number of bits. The ADC must also have an appropriate dynamic range otherwise distortion problems can arise, since the ADC cannot accurately handle signals that are extremely weak compared to the strongest signals. In modern spectrometers, however, the dynamic range is always higher than 105, and nowadays phase-sensitive analogue detectors are linear over a wide range of signal sizes. Fully-digital instruments are also available which increase the sensitivity without introducing any phase distortion.
Before performing an NMR measurement, it is important to decide the required spectral resolution; for equivalent signal-to-noise ratio, the acquisition time is proportional to the reciprocal of the resolution. In order to increase the resolution, one can either increase the memory size or decrease the NMR spectral width. For the resolution required from the carbonyl region of 13C NMR time domain spectra of olive oil a corresponding size of 256K words was necessary!
Standard measurable parameters
The basic information observed in a NMR spectrum is simply a spectral line characterised by its intensity, its line width and its spectral position (the spectral frequency). The standard measurable parameters of a given spectral line are:
- The position of the centre of the line (resonance): referred to as its chemical shift. It is usually given in ppm derived from:
- chemical shift (ppm) = 106[sample frequency – reference frequency] / carrier (spectrometer operating) frequency).
- The multiplicity for split lines: derive from neighbour interactions and the magnitude of separation (splitting) is termed the coupling constant.
- The line intensity: it is properly measured as the area under the line and reflects accurately the number of nuclei in this environment. If the line intensity is measured as a transient in time-dependent experiments, it yields other dynamic parameters, which are useful in the physico-chemical characterisation of the system.
- The line width: it is usually measured at half height of the signal and contains information on the rate of processes, including the rates of molecular motion.
1H Spectral assignment
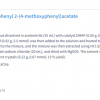
Some basic features of an 1H NMR spectrum are shown in Figure 1(a); this is the 600.13 MHz 1H spectrum of triolein, see Scheme 1. To facilitate observation, corresponding signals are given in different colours.
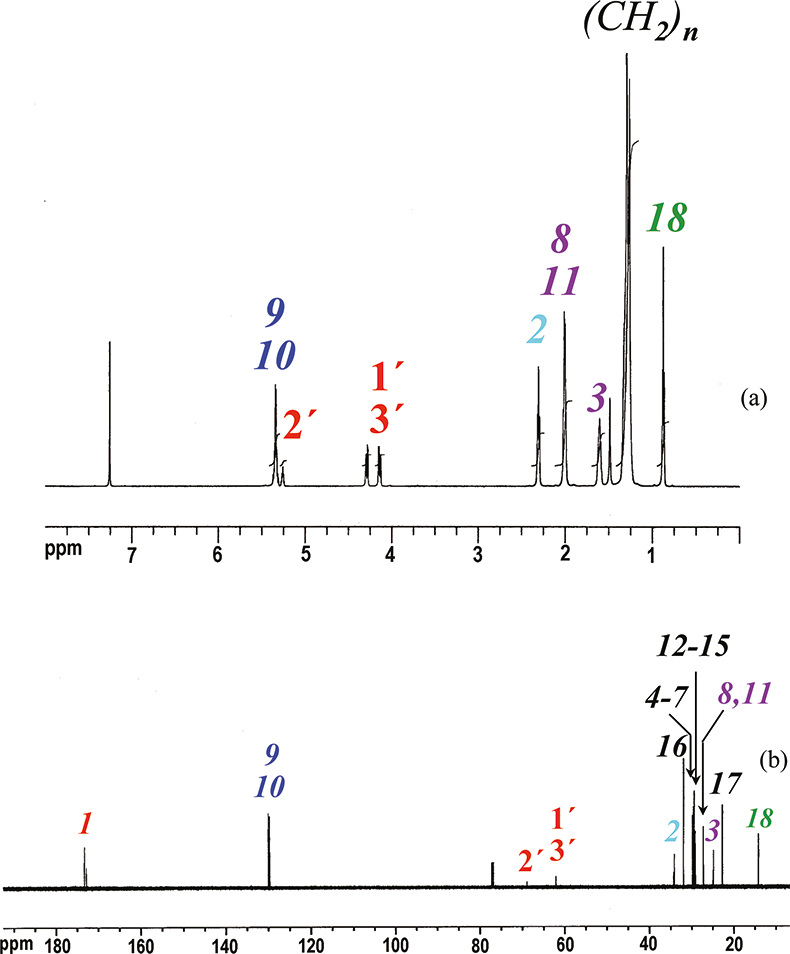
Figure 1. 1H (a) and 13C (b) NMR spectra of triolein in CDCl3 at 300K. Peaks are identified as reported in Scheme 1.
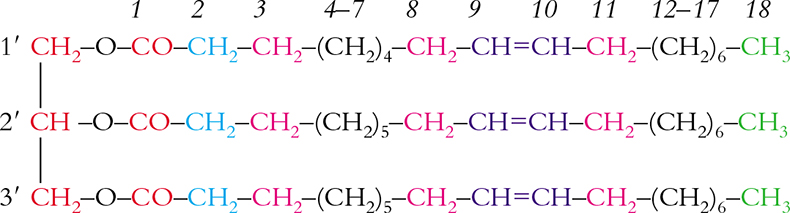
Scheme 1. Triolein and relative numbering.
It is important to note that the line intensities (integrals) of the signals are strictly proportional to the number of protons present in each functional group.
The above spectral assignment can be easily ascertained by 2D NMR methods.
13C Spectral assignment
An example of a 13C spectrum of triolein is given in Figure 1(b). The assignment of a 13C spectrum can be obtained using different 2D and 1D selective experiments that involve several steps. For triolein the experiments following were required:
- 13C spectrum of the sample, see Figure 1(b). All 13C signals of the triolein are shown.
- 1H spectrum of the sample, see Figure 1(a). All 1H signals of the triolein are shown.
- 2D heterocorrelated experiment. This experiment allows one to correlate the 1H and 13C spectra.
- 2D INADEQUATE experiment. This experiment, although cumbersome and very insensitive, is, however, able to connect the resonances of nearby C atoms. When two 13C resonances are sufficiently separated to be resolved in 2D experiments, this experiment allows us to obtain the 13C assignment.
- 1D selective INADEQUATE experiment, see Figure 2. In this experiment, one resonance at a time is excited. The resonances due to nearby carbons, and only those, will appear as antiphase doublets. In the case of triolein, the selective excitation of C-16, gives rise to two signals due to the neighbouring carbons, i.e. C-15 and C-17: the selective excitation of C-3 gives rise to two signals due to C-2 and C-4. This procedure can be repeated until a full spectral assignment is obtained.

Figure 2. Top trace: 13C spectrum in the 22.0–34.0 ppm range of triolein. After the excitation of the selected resonances selective INADEQUATE antiphase doublets are observed. The selected resonances are evidenced with an arrow, C-16 in the middle trace and C-3 in the bottom trace.
Using the procedure above, it has been possible to assign the 13C spectrum of many compounds. In particular, it is possible to assign the spectra of “standard” compounds present in food. Some of these standard compounds are the common tri-alkyl esters such as tripalmitin, triolein, trilinolein, tri-11-eicosenoin. The assignment of the spectra of these standard compounds can be useful for analysing the spectra of natural mixtures such as vegetable oils. Although, in order to assign correctly the resonances of standard compounds present in mixtures, it is useful sometimes to use the “method of addition”. This simple method requires the acquisition of the following spectra:
- spectrum of the sample
- spectrum of the standard compound
- spectrum of the sample + standard compound.
In the spectrum of the sample + standard compound, only the signals due to the standard compound will show an increment increase in the intensity. This method has been used in the full assignment of the 13C spectrum of an olive oil. A small amount of tri-alkyl esters such as tripalmitin, triolein, trilinolein, tristearin, 11-vaccenic triester etc. was added to olive oils, see Figure 3; the analysis of the spectra before and after the addition of the standard compounds has enabled the full assignment of the 13C spectrum of the olive oil.
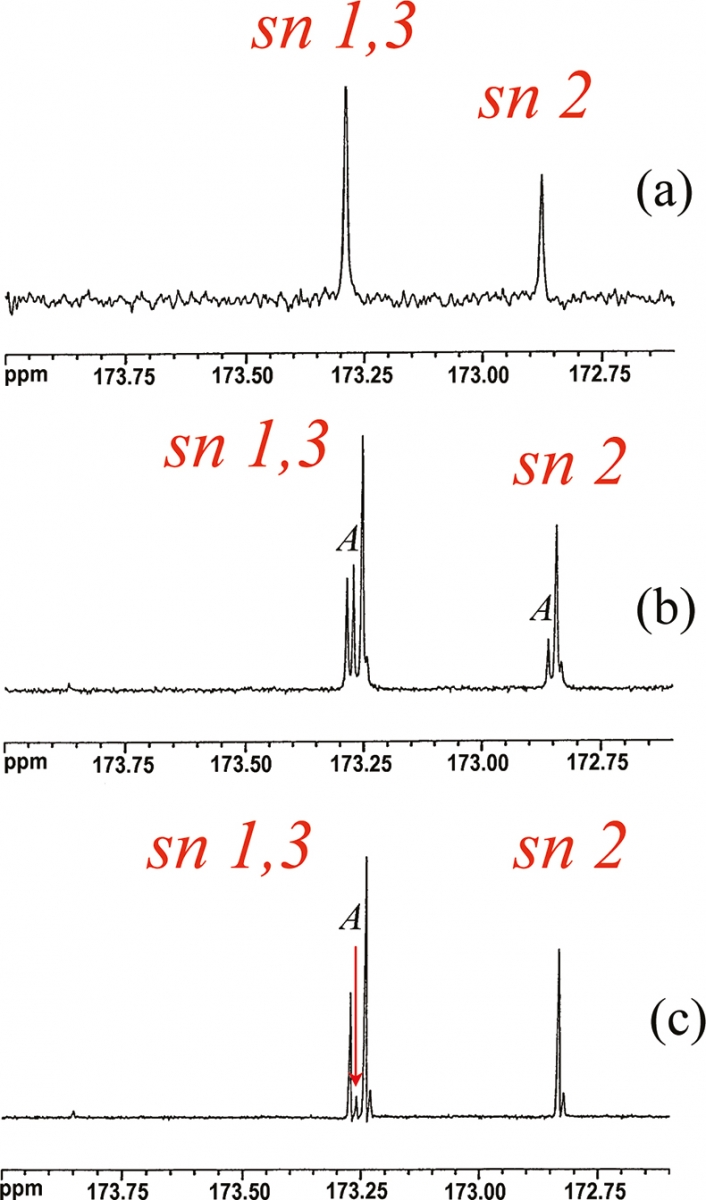
Figure 3. Expansion of the carbonyl region in the 13C spectra of (a) 11-vaccenic triester, (b) olive oil + 11-vaccenic triester, (c) olive oil. A = tri-vaccenic fatty chain. sn 1,3 and sn 2 are the positions 1,3 and 2 on the glycerol moiety.
Quantitative NMR
The 1H NMR spectrum of an olive oil is shown in Figure 4. In the spectrum of olive oil, it is always necessary to perform a careful baseline correction and to normalise the spectrum choosing a suitable resonance. Therefore all major resonances will in turn be normalised in proton equivalents. A good choice is to set to 1000 the intensity of a resonance at 1.61 ppm arising from all the CH2 in the β position to the CO group.
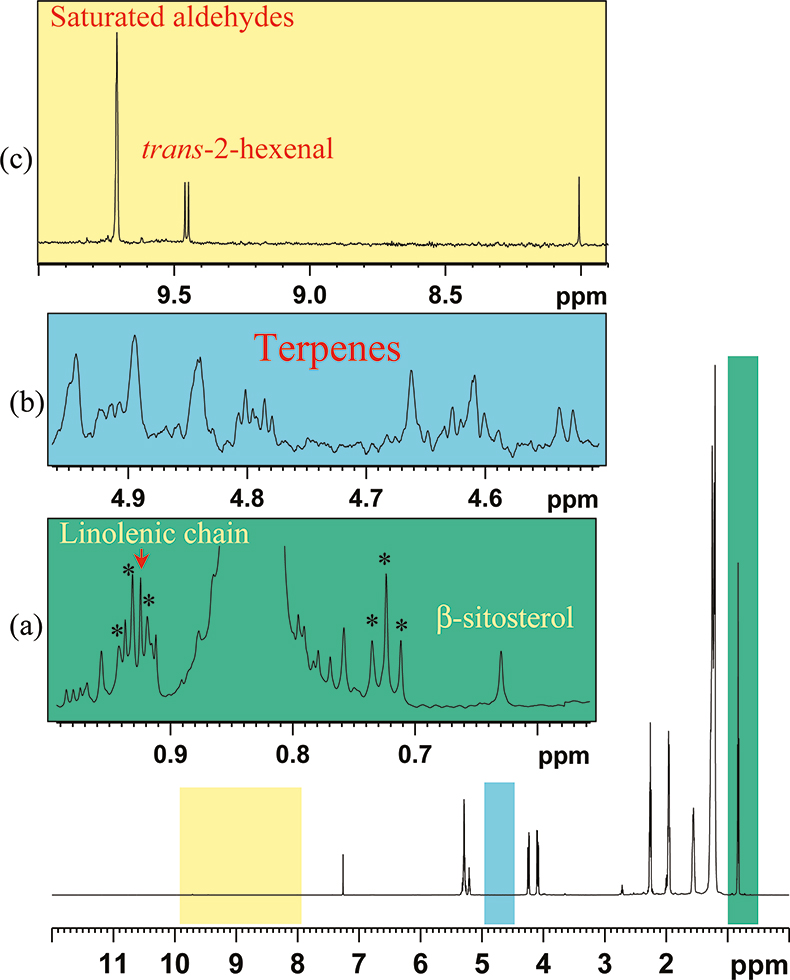
Figure 4. 600.13 MHz, 1H NMR spectrum of an olive oil and expansion of selected regions (a–c). 13C satellites are denoted with the symbol *.
The 13C isotope has spin ½ and a natural abundance of 1.108%. The presence of this isotope in all organic compounds causes a strong splitting of 1H NMR lines from protons directly bound to 13C carbon atoms and gives rise to the so-called satellite lines. Satellite lines of a chosen signal are a perfect internal standard for weaker resonances in quantitative NMR analysis.
Olive oil quality and adulteration
The European Community regulation (2568) requires many different analyses for the analytical definition of olive oil quality.2
Free acidity
One of the best-known conventional analyses is the measure of the free acidity, which is obtained with traditional chemical methods. The 1H NMR spectrum of an olive oil in CDCl3/DMSO does not allow one to obtain this information directly; however, it is possible to have an indirect measurement of free acidity using the measurable amount of diglycerides. The 1H NMR spectrum shows the resonances of sn 1,2 and sn 1,3 di-glycerides at 3.639 and 3.994 ppm, respectively, see Figure 5. The total diglycerides profile and the 1,2 : 1,3 ratio are strongly related to the quality and the freshness of olive oils; in fact, 1H NMR spectrum of lampante olive oil, Figure 5(b), shows a much higher amount of total diglycerides if compared to the spectra of extra virgin olive oils, Figure 5(a).
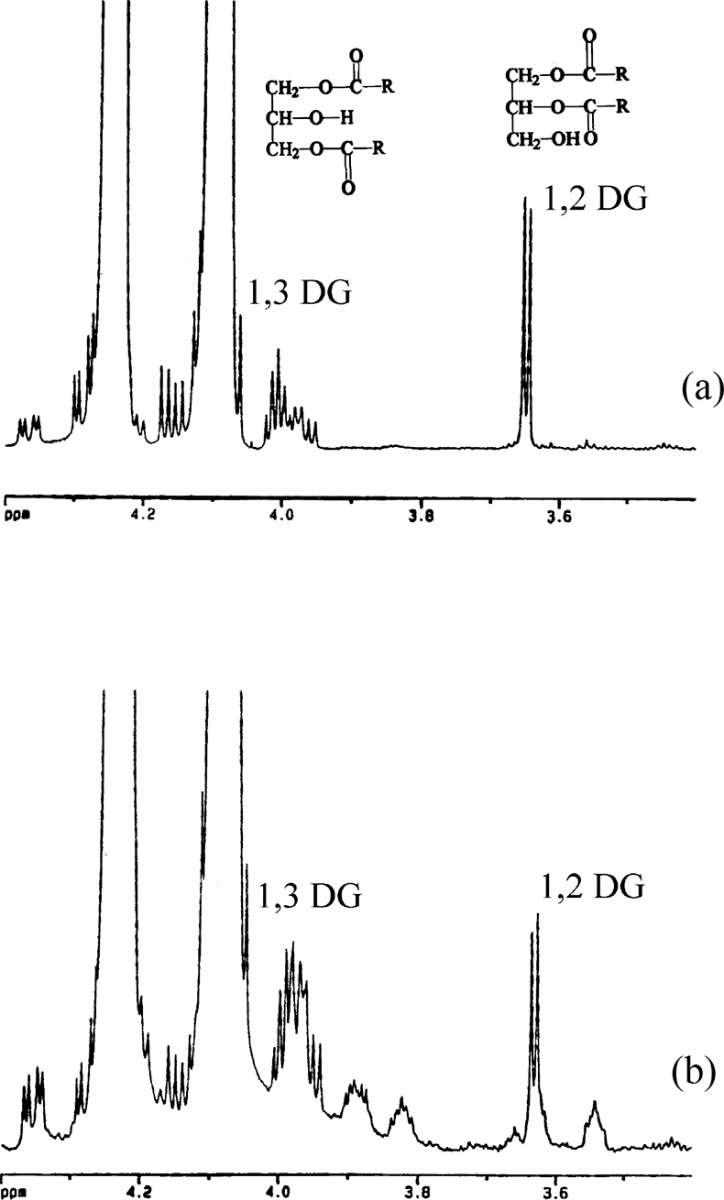
Figure 5. Expansion of the 3.4–4.4 ppm proton spectral region. 1,2 and 1,3 di-glyceride (DG) resonances are shown. (a) extra virgin olive oil; (b) “lampante” olive oil.
Fatty acid profile
Another important traditional analysis is the determination of fatty acid profile, which is usually obtained by gas-chromatographic analysis. Gas-chromatographic methods give the full composition of fatty chains without information about the fatty chains distribution on glycerol; the distribution can be easily obtained from the analysis of 13C NMR spectra, see Figure 6(a). The carbonyl region of the spectrum allows the observation of two groups of resonances. One group is due to fatty chains in position 1,3 of the glycerol moiety, the other group is due to fatty acids in position 2. Thus, gas chromatography and 13C NMR are two methods that must be considered complementary and not as alternatives. (Enzymatic methods for determination of the fatty chains distribution on glycerol are too inaccurate to be considered here, even if they are officially recognised European methods.)
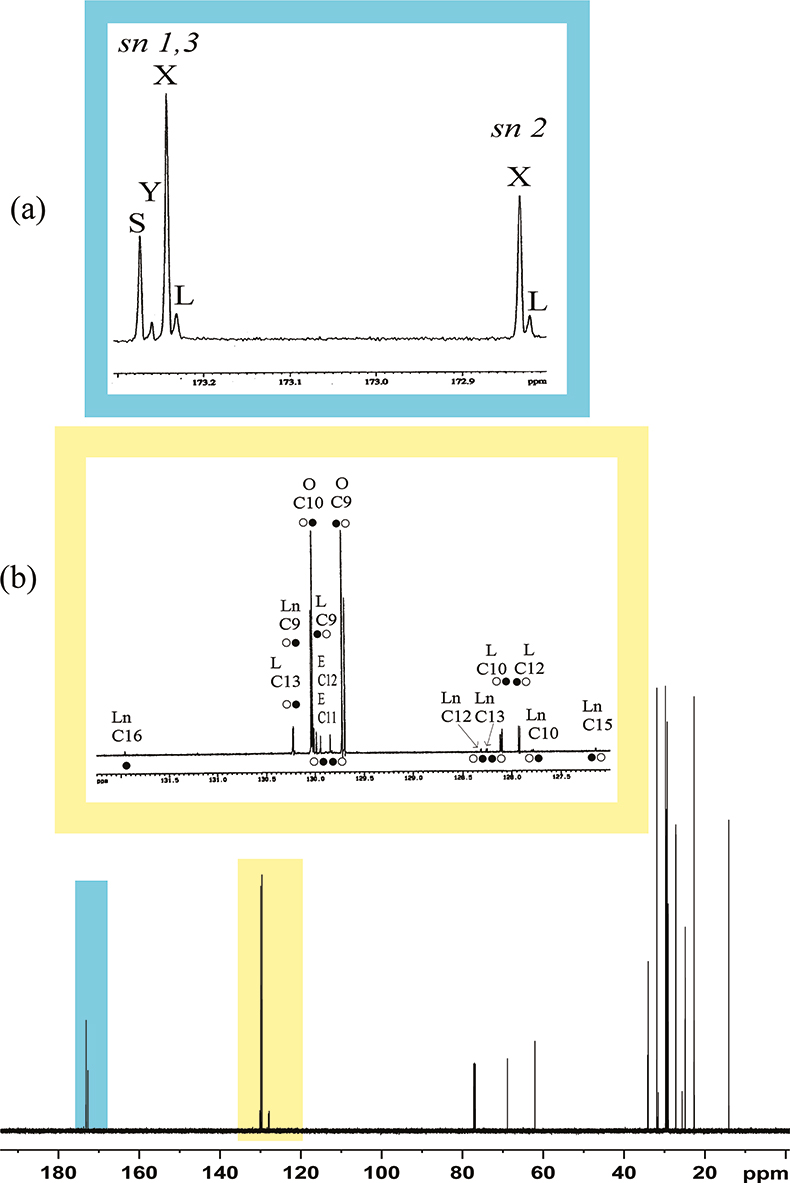
Figure 6.150 MHz, 13C NMR spectrum of an olive oil. (a) Expansion of carbonyl region, S = saturated chains; y = eicosenoic and vaccenic chains; X = oleic chain; L = linoleic chain; (b) 13C double bonds region, O = oleic chain; E = eicosenoic and vaccenic chains; L = linoleic chain; Ln = linolenic chain. * = resonances due to coincident signals from sn 1,3 and sn 2 chains; • = resonances due to 2 signals.sn 1,3 signals; ) O = resonances due to sn 2 signals.
Unsaturated fatty acids
The conventional method used to determine the total degree of unsaturation is the measure of the Iodine Number (IN). The IN of unsaturated fatty acids is not a quantitative measure; it is an empirical number that is useful in defining the total amount of unsaturation. From a 1H NMR spectrum one can obtain a quantitative measure of the unsaturation in a different way. All resonances of trans double bonds lie between 5 and 5.2 ppm and are due to two protons; all methyl resonances, three protons, lie between 0.85 and 0.95 ppm; thus the total unsaturation number, in moles, is given by the ratio between the normalised integrals of these two spectral regions. However, in a more detailed way, by observing carefully the spectral region 120–130 ppm in the 13C spectrum, see Figure 6(b), we can obtain the full composition in terms of unsaturated chains as well as their position on the glycerol moiety.
Sterols analysis
The conventional analysis of sterols is performed using gas-chromatographic methods. In 1H NMR spectra all the peaks observed in the range of 0.57–0.70 ppm are due to methyl in position 18 of steroids, hence to gain information about the steroids composition we can interpret these spectra in a manner similar to that of a chromatogram, see Figure 4(a).
Particularly interesting is the case of hazelnut oil, Figure 7(a), which lacks almost completely any linolenic acid C18:3 and is very low in saturated fatty acids, Figure 7(b). Thus, the low intensity of the C18:3 methyl resonance in an olive oil 1H NMR spectrum might signify hazelnut adulteration, while, when this resonance is too intense, seed oil might have been added. The presence of a very weak resonance at 1.20 ppm, see Figure 7(b), must again be checked since a very low content of saturated chains might be due to adulteration. In these cases a careful chromatographic analysis and a 13C NMR spectrum must be performed.
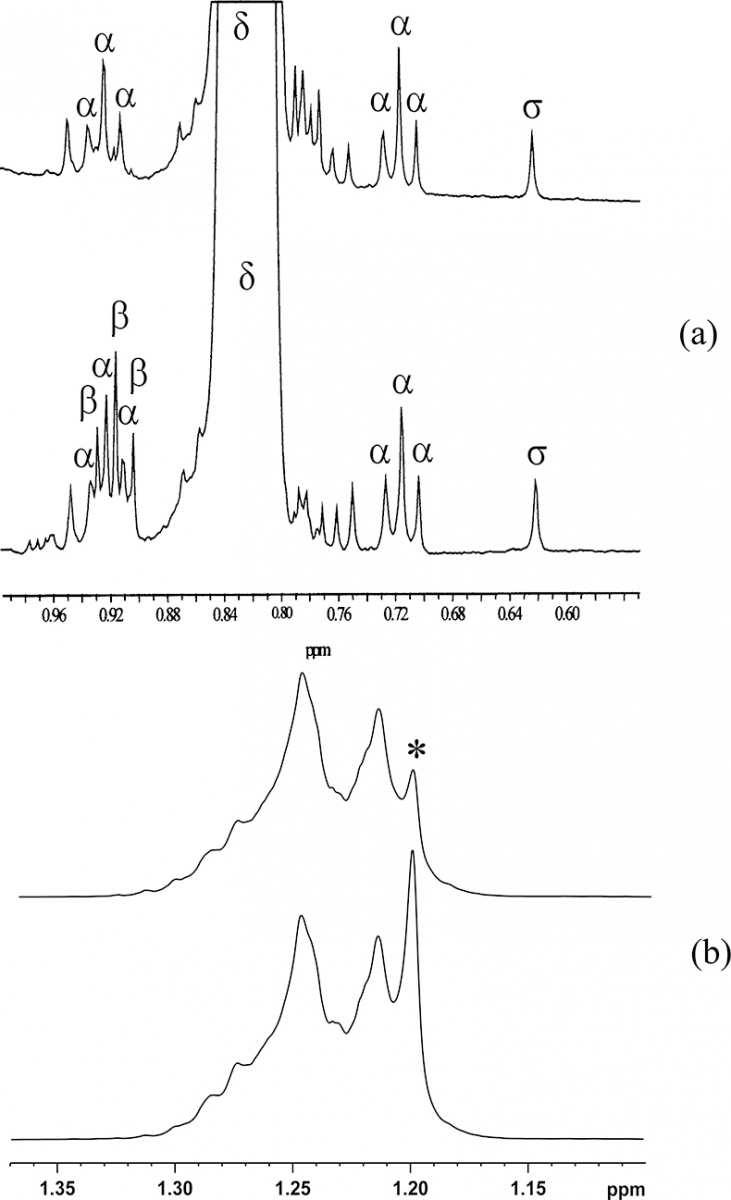
Figure 7. (a) Expansion of the 0.55–1.00 ppm proton spectral region of olive (bottom) and hazelnut (top) oils: α = 13C satellite of the main methyl resonance (δ); β = terminal methyl of linolenic chain; σ = CH3-18 of β-sitosterol. (b) Expansion of the 1.3–1.00 ppm proton spectral region of olive (bottom) and hazelnut (top) oils: * = saturated fatty acids resonance.
Determination of squalene, cycloarthenol and Mg-depleted chlorophyll
Squalene is always present in olive oils, in amounts of the order of 12.5–75.0 mg / 1000 g of oil. The 1H spectrum of this compound is quite complex, but one of its resonance at 1.620 ppm emerges clearly from the complex spectral pattern of the olive oil, see Figure 8(a). The lack of this resonance is always due to full rectification of the sample or signifies adulteration.
Cycloarthenol is a complex steroid characterised by the presence of a three-member ring. 1H resonances due to cyclopropanic ring are to be found at high field in a spectral range completely empty of other resonances, see Figure 8(b). Usually two sets of resonances are observed. One set is indeed due to cycloarthenol, while the other one is due to a transposition of the double bond on the sterol structure. Anyhow the amount of both cycloarthenol products can be measured precisely.
Chlorophyll is sometimes added to improve the green colour of olive oils. In this case usually the added product is defective, lacking the coordinated magnesium and contains NH groups in the centre of the macro-cycle of the porphyrin structure. In this case, the 1H NMR spectrum of olive oil shows a broad signal at –0.42 ppm, see Figure 8(c), indicating adulteration of the product.
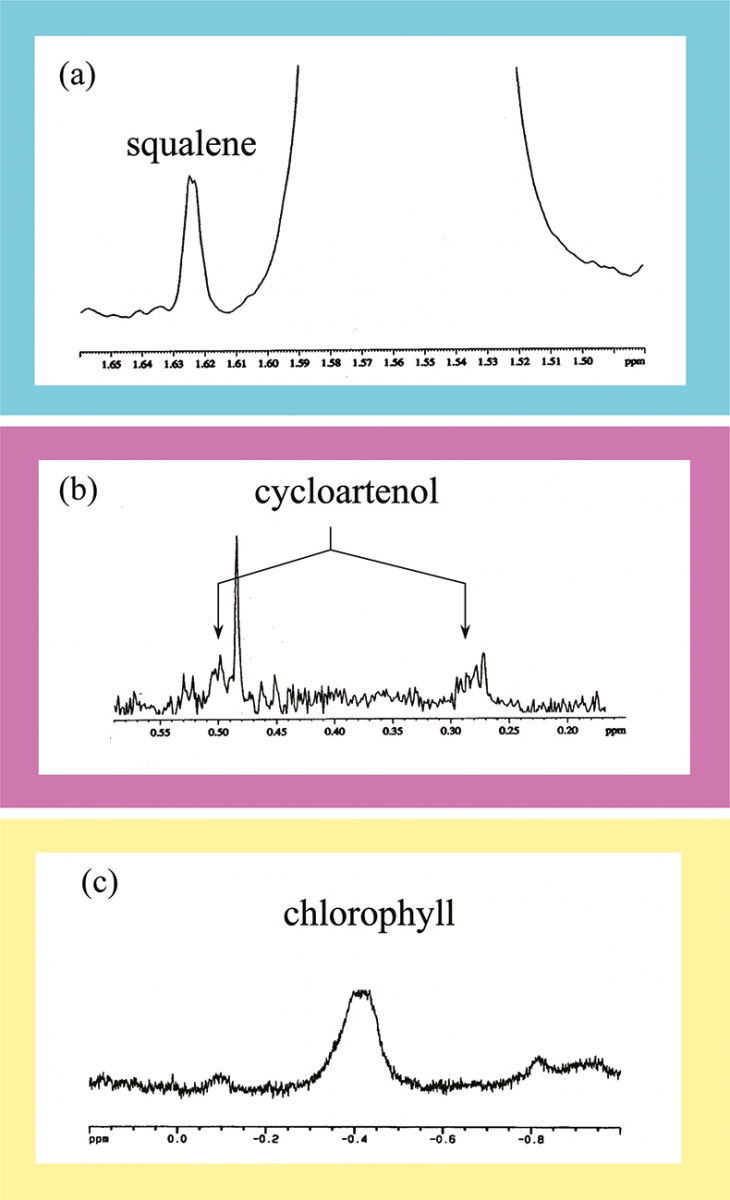
Figure 8. Expansions of the 1H spectrum of an olive oil: (a) resonance due to squalene; (b) resonances due to cycloarthenol and (c) resonance due to NH groups of porphyrin in a Mg depleted chlorophyll.
Olive oil sensory quality
Sensory attributes of olive oils are usually evaluated through the so-called panel test. Positive and negative attributes are due to the presence of particular compounds such as polyphenols, aldehydes, terpenes, oxidation products etc. Some resonances responsible for particular attributes have been identified and can be observed and quantified in the 1H spectrum, see Figure 9.
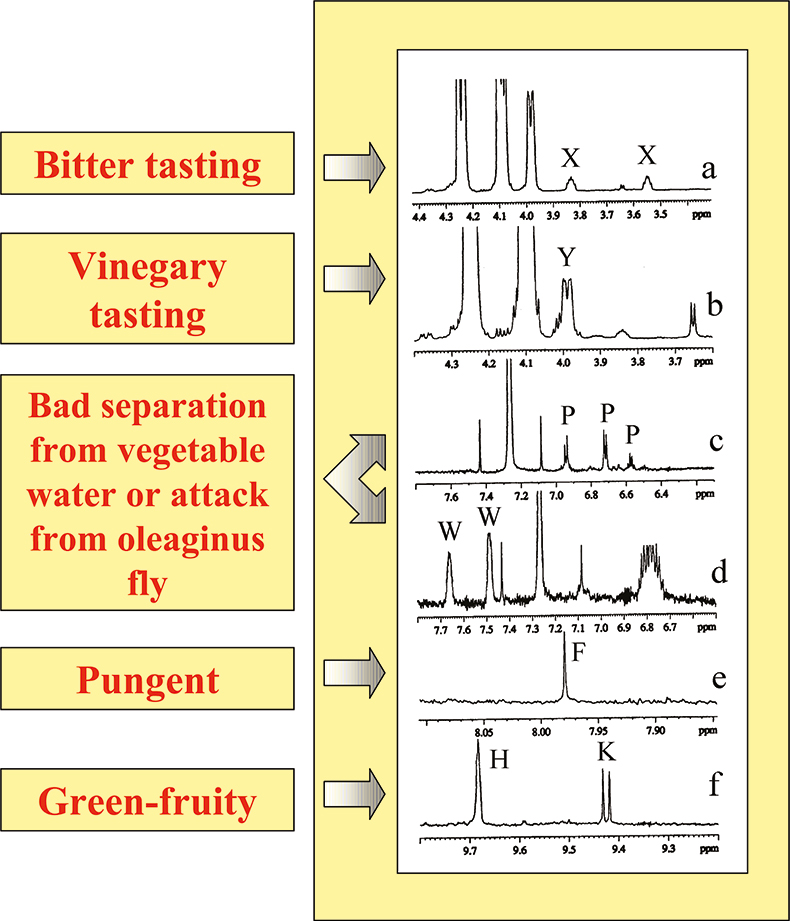
Figure 9. 1H spectral regions of particular olive oils. Characteristic resonances are labelled as: (a) X in a bitter olive oil; (b) Y in a vinegary tasting olive oil; (c) and (d) P and W in the presence of a large amount of soluble phenols as in the case of bad separation of oil from vegetable water; (e) formaldehyde present in olive oils classified as pungent; (f) K and H aldehydes in green-fruity olive oils.
Data preparation for multivariate analysis
Any statistical procedure appropriate to producing clustering of products according to particular criteria must be done only after a careful choice of variables. In the case of olive oil different variables have been selected for specific problems. Applications of the above concepts are now discussed.
The proposed statistical procedure to be performed on the intensity of selected resonances is:
- Analysis of Variance (ANOVA) on most NMR resonances in order to select X resonances;
- Principal Component Analysis (PCA) on the X selected resonances to obtain a small number of linear combinations without a significant loss of useful information;
- Tree Clustering Analysis (TCA) on X selected resonances without any a priori hypothesis;
- Linear Discriminant Analysis (LDA) on the X selected resonances with the a priori hypothesis suggested by the PCA analysis. For instance the number of places of production of oils, or in some other case the number of cultivars.
- Reliability of the system. In order to prove the reliability of the statistical system, some randomly-selected olive oil samples were not included in developing the statistical analysis model but were used as unknown samples in further calculation. If the selected unknown samples are well classified, the system is stable and can be used for real systems.
For each specific problem the statistical procedure allows the choice of the most significant resonances. Since the variability of the NMR resonances is dependent on many different factors such as environment, cultivars, particular defects of the olive oil and the year, it is important to repeat the statistical analysis each time. This means that the correct resonances, i.e. those with the highest discriminating power, must be identified according to the specific problem. For instance, a resonance due to a specific compound may be important in the discrimination of non-European olive oils but not relevant within a European group.
Authentication of olive oil
As previously shown, see Figure 6, 13C resonances are indeed sensitive to the position of the fatty acid on the glycerol moiety. Therefore, NMR methods represent a powerful way of determining not only the fatty acid composition but also their distribution on glycerol.
Any olive oil in which a palmitic residue is found in position 2 of the glycerol must be considered as a fraud.
1H NMR can be used to analyse oils of different botanical origin such as refined hazelnut oil and seed oils. In order to evaluate the possibility of detecting hazelnut oil present in adulterated olive oil samples, NMR and gas chromatography can be used. Even in the absence of a specific marker, the presence of hazelnut oil can be detected on the basis of its low content of linolenic and palmitic acids and squalene. This method permits one to detect hazelnut oil addition to an extent of about 12% (EU Project MEDEO).
Agronomical choices
In order to find out which cultivar is the best for growing in extreme climatic conditions, the composition of olive oils obtained from a few matched Mediterranean cultivars grown in experimental fields located in Italy and in the Catamarca region of Argentina have been checked. Olive oils were analysed by NMR, gas chromatography and statistical analysis. All oils from olives grown in Europe under a mild climate can be easily distinguished from their Argentine counterpart, see Figure 10. However, some olive cultivars keep better their original character. The Mediterranean cultivar less affected by the climatic conditions present in Catamarca, Argentina, is “Cerasuola” from Sicily. In fact, TCA analysis shows that Cerasuola olive oil produced in Argentina is grouped together with the Italian ones, see Figure 10. Therefore this cultivar can be proposed as colonising plants in extreme pedoclimatic conditions of Catamarca region.
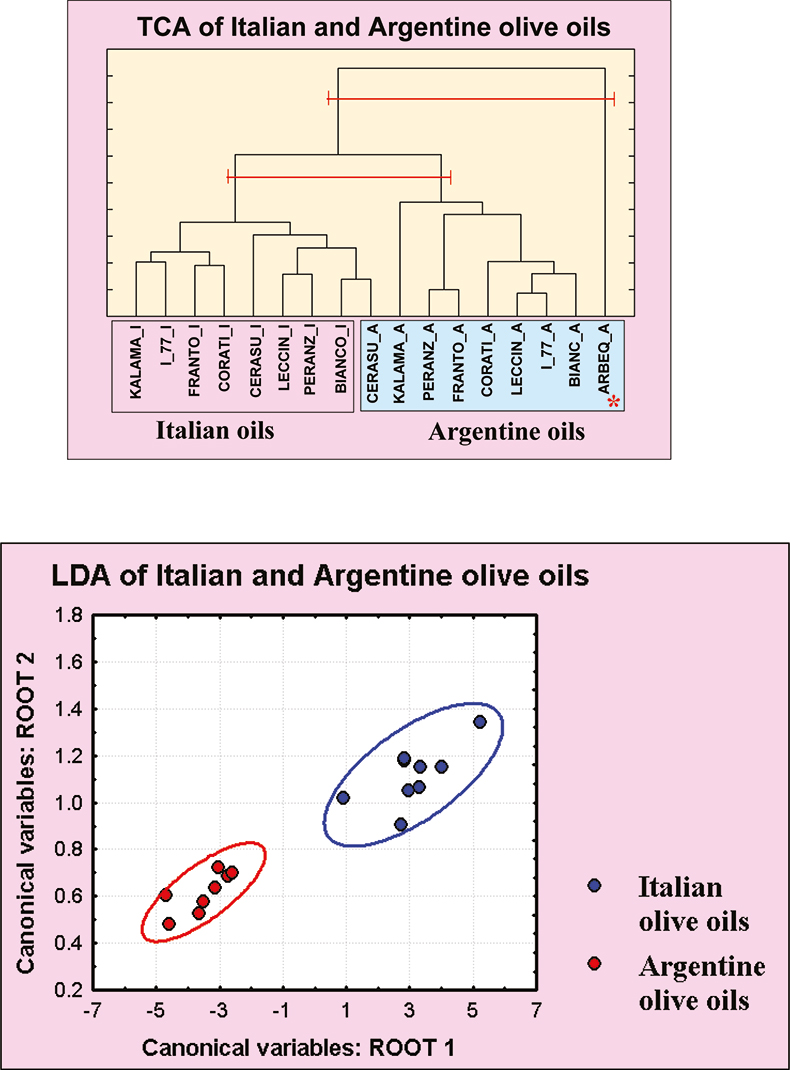
Figure 10. (Top) TCA dendrogram showing the clustering based on 13C NMR data of Italian and Argentine olive oils. Two levels corresponding to a different number of groups are marked. (Bottom) Linear Discriminant Analysis plot based on the same data. Note the olive oil sample “Arbeq” grown in Argentina from a Spanish cultivar is different from all the others.
Varietal classification of olive oils—Pedoclimatic effect in olive oil composition
13C high-field NMR and gas chromatography combined with a multivariate statistical procedure allow one to group monovarietal olive oils belonging to particular cultivars. These techniques were used to analyse 60 extra virgin olive oils from the same Italian region (South-Western Sicily) and Puglia obtained from four monovarietal cultivars.3 A selection of NMR or GC peaks based on their sensitivity to the different cultivars was performed using Multivariate Analysis of Variance (MANOVA). Then, for both experimental techniques, PCA, TCA and LDA were performed on the MANOVA selected peaks. Grouping of olive oils according to their cultivars occurs for particular 13C resonances all belonging to fatty chains in the sn 1,3 position of the glycerol moiety, see Figure 11.
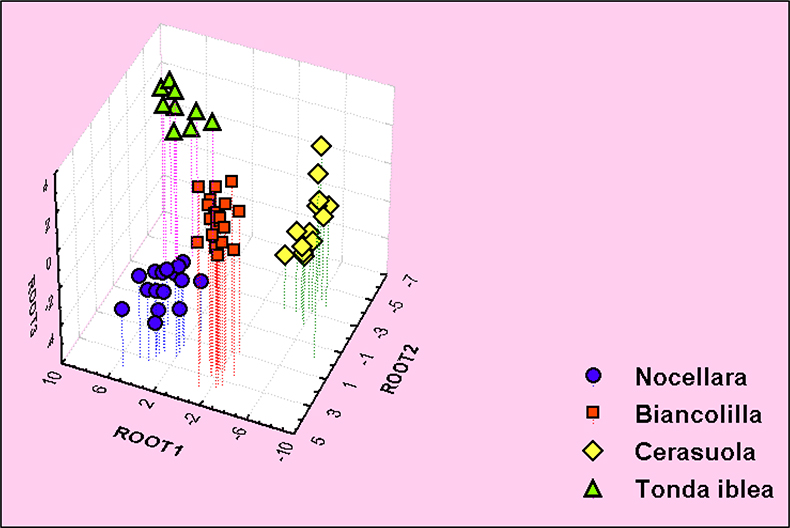
Figure 11. Three-dimensional Linear Discriminant Analysis plot of 60 Sicilian extra virgin olive oils. LDA based on selected peaks from 13C spectrum. Samples labelled with the same symbol come from the same cultivar.
PDO: Protected Designation of Origin, the geographical effect
An important act of legislation, the PDO (Protected Designation of Origin) (EU, 1992) allows some Mediterranean extra virgin olive oils to be identified with the names of the geographical areas where they are produced. This certification improves the value of the Italian, Greek and Spanish products and assures a product of high quality and defined origin.
Table 1.
Compound | 1H (ppm) |
β-sitosterol | 0.623 |
Squalene | 1.621 |
Terpene | 4.530 |
Terpene | 4.627 |
Terpene | 4.654 |
Cycloartenol | 4.881 |
Formaldehyde | 8.007 |
Hexanal | 9.705 |
Branched aldehydes | 9.528 |
Branched aldehydes | 9.616 |
Trans-2-hexenal | 9.448 |
Here, a very simple case based on five Italian districts is reported.4 In four of these districts, Lucca, Arezzo, Lazio and Garda, various cultivar are present with quite a few samples belonging to the same cultivar, while in a fifth district, Seggiano (Southern Tuscany), only a monovarietal oil is produced (cultivar Seggianese). The LDA based on 11 1H selected resonances (β-sitosterol, squalene, four terpenes and four aldehydes), see Table 1, gives the perfect separation reported in Figure 12. The pedoclimatic effects are well discriminated and we are able to separate oils coming from different geographical regions, even when these regions are contiguous. In this regard the NMR capability to distinguish olive oils on the basis of their geographical origin seems unique.
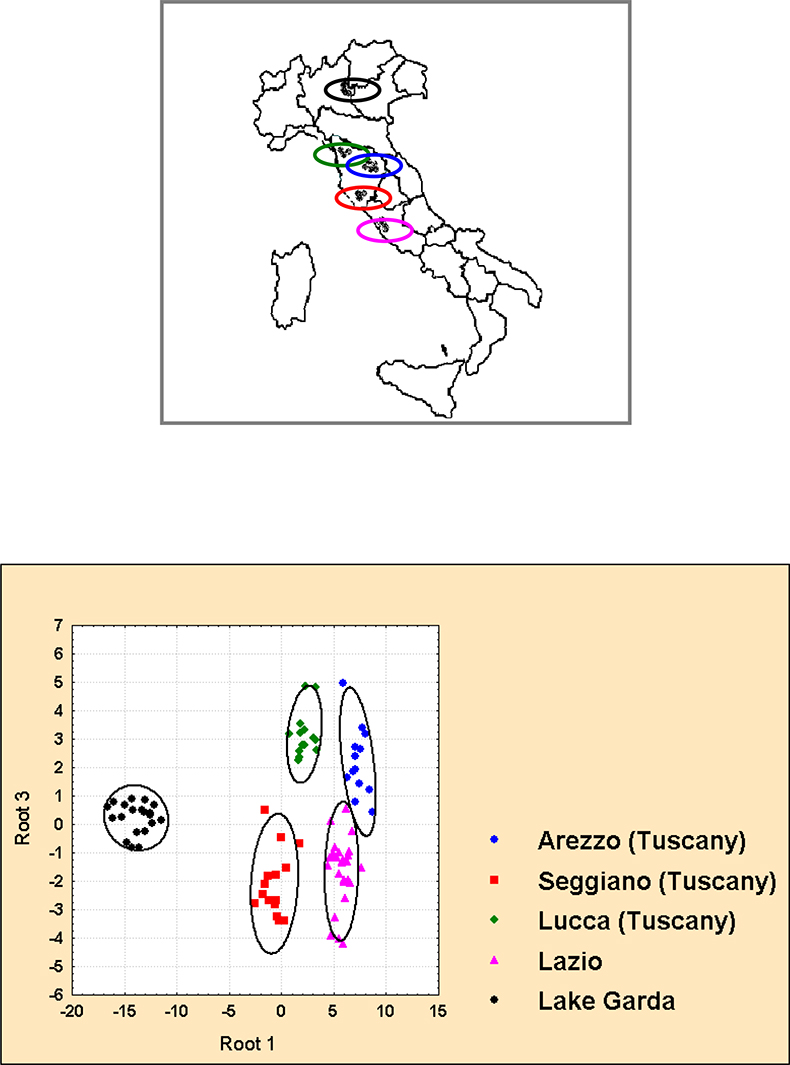
Figure 12. Linear Discriminant Analysis of extra virgin olive oils coming from five Italian districts (Garda, Lucca, Arezzo, Seggiano, Lazio). Ellipses represent the 95% confidence regions for each group. Samples labelled with the same symbol come from the same region.
On a larger base we have shown that 1H NMR is able to perform a geographical selection on olive oils regardless of their cultivar even if different years are considered.4
References
- L. Mannina and A.L. Segre, “High Resolution NMR: from Chemical Structure to Food Authenticity”, Grasas y Aceites 53, 22–33 (2002). https://doi.org/10.3989/gya.2002.v53.i1.287
- European Community Regulation 2568/91, Official J. European Community L248.
- L. Mannina, G. Dugo, F. Salvo, L. Cicero, G. Ansanelli, C. Calcagni and A.L. Segre, “Study of the Cultivar-Compoition Relationship in Sicilian Olive Oils by GC, NMR, and Statistical Methods”, J. Agr. Food Chem. 51, 126–127 (2003). https://doi.org/10.1021/jf025656l
- L. Mannina, M. Patumi, N. Proietti, D. Bassi and A.L. Segre, “Geographical Characterization of Italian Extra Virgin Olive Oils Using High Field 1H-NMR Spectroscopy”, J. Agr. Food. Chem. 49, 2687–2696 (2001). https://doi.org/10.1021/jf001408i