
Andrew I. Whitehouse
Applied Photonics Ltd, Unit 8, Carleton Business Park, Skipton, North Yorkshire BD23 2DE, UK
DOI: https://doi.org/10.1255/sew.2006.a1
Introduction
Laser Spark Spectroscopy (LASS), Laser-Induced Plasma Spectroscopy (LIPS) or, as it is more often known, Laser-Induced Breakdown Spectroscopy (LIBS), is a form of atomic emission spectroscopy in which a pulsed laser is used as the excitation source. The development of LIBS can be traced back to the work of Frederick Brech and Lee Cross during 1962 when they reported the observation of emission spectra from a metal target using a ruby maser.1 The use of a pulsed laser to produce a luminous plasma for the purpose of spectrochemical analysis of a material was first reported in 1963 by a research group at the Ford Motor Company (Dearburn, Michigan) who used a “giant pulse”, Q-switched ruby laser.2 A few years later, members of this research group applied the same experimental technique to molten stainless-steel samples, producing calibration curves for nickel and chromium that were found to be very similar to those obtained using solid samples.3 This clearly demonstrated the potential of LIBS for remote characterisation of hazardous materials although at that time the lack of suitable lasers and optical detectors hampered the development of this new technique. Over the next two decades, advances in laser technology were such that real-world applications could be considered more seriously, but it was not until the 1980s that detector technology had advanced sufficiently to allow LIBS to become more than just a scientific curiosity. The availability of time-gated CCD array detectors made a major impact on the development of LIBS as they were found to be particularly useful for recording the transient emission spectra from laser-induced plasma. Many of the current manifestations of LIBS originate from work dating back to the early 1980s by Leon Radziemski, David Cremers and co-workers at Los Alamos National Laboratory (New Mexico, USA), and it was from this group that the acronym LIBS first appeared.
Instrumentation and measurement methodology
The essential components of any LIBS system are i) the laser, ii) the optical spectrograph, iii) the optical system used to transmit the laser radiation to the sample and collect plasma light for transmission to the spectrograph, and iv) the computer and associated software to perform data acquisition and data analysis. The general arrangement of a LIBS system is illustrated schematically in Figure 1.
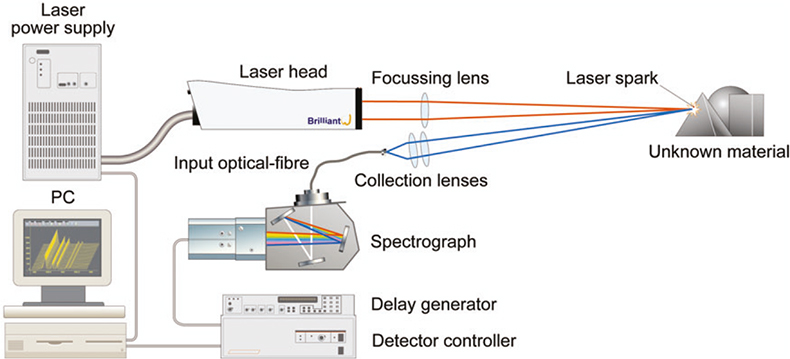
Figure 1. General arrangement of a LIBS system.
Although certain other laser types may be used with LIBS, the laser of choice is often the ubiquitous Q-switched Nd:YAG, which are available in various forms from a number of manufacturers and which are in widespread use in many industrial, scientific and medical applications. A key requirement of the laser and associated optical transmission system is that the power density at the sample surface is sufficient to produce both ablation of the sample and the formation of a luminous plasma. Typical power densities used in LIBS range from approximately 0.5 to 5 GW cm–2. It should be noted that when operating at the lower end of this range, in certain cases (e.g. a solid metal sample) it is possible to produce a plasma at a power density below the threshold required for sample ablation. Under these conditions, the recorded emission spectrum may contain only weak or sometimes no emission lines from elements contained within the sample and hence is of no value when attempting to determine the composition of the sample.
Optical spectrographs suitable for LIBS are also available commercially from a number of manufacturers but are usually of the Czerny–Turner configuration and equipped with an Intensified Charge-Coupled Device (ICCD) array detector. Within the last several years, however, the so-called echelle spectrograph has become available in a form suitable for LIBS. The echelle design has the advantage that a broad-band spectrum (typically 200–900 nm) may be recorded in high-resolution for each laser plasma event, whereas this is usually not possible with other spectrograph types unless multiple devices are used.
Although not always essential, it is very much the norm to use a time-gated detector with LIBS—the preferred method of gating being to electronically control the intensifier of an ICCD detector. The temperature of the LIBS plasma can reach 20,000 K during and immediately after the laser pulse (which is typically 3–10 ns in duration), and the optical emission from this hot and dense plasma is dominated by Bremsstrahlung radiation which manifests itself as a broad continuum in the recorded emission spectrum. Time-gating the detector with respect to the laser pulse may be used to allow sufficient time for the plasma to expand and cool to a point where the Bremsstrahlung radiation is no longer dominant over the atomic and ionic emission lines arising from excited atoms and ions present in the plasma. The optimum time delay is typically 1 μs although this can vary depending upon many factors including laser wavelength, power density at the sample surface, sample composition and physical state, ambient gas pressure etc. It is usual to optimise the delay time for a given LIBS system configuration, measurement conditions and material type. The time gating capability of ICCD detectors also offers a convenient method of selecting a detector gate width (integration time) which provides adequate signal-to-noise while minimising the contribution to the recorded spectrum from ambient light. Typical gate widths used in LIBS range from 1 to 10 μs.
At least three manufacturers are now offering compact, low-cost, CCD array spectrometers suitable for LIBS. The detector arrays used in these miniature spectrometers are not of the intensified type but a limited time-gating capability is possible and so they are useful in some applications of LIBS, especially where robustness and portability are important. Due to their low cost and compact size, it is possible to stack several spectrometers together so as to allow the recording of broad-band, high-resolution spectra from a single LIBS plasma event. They therefore offer an alternative to the more expensive echelle / ICCD array detector spectrographs.
The measurement methodology adopted in LIBS will to a large extent depend on the nature and requirements of the application. Quantitative measurements using LIBS require a carefully thought out methodology if a reasonable level of precision is expected. For most cases, it is necessary that the bulk material is homogenous on the sampling scale of the laser beam, which is most usually very small (for solid samples such as steel, typically a few hundred μm in diameter by a few μm in depth per laser pulse). Although it is usual to record spectra from a relatively large number of laser pulses in order to achieve adequate signal-to-noise, it is sometimes possible to use just one laser pulse. This is often the case when attempting to analyse surface residues, where multiple laser pulses would eventually remove the residue and expose the underlying material to the laser beam.
An often (over-) stated attribute of LIBS is that there is no need for sample preparation but this can be misleading. LIBS is clearly a surface analysis technique and, accordingly, will provide information relating to the composition of the surface of the material under examination. But the surface of a material is seldom representative of the bulk; and what if the sample has some form of surface contamination or coating? For analysis of the bulk material, clearly a degree of sample preparation is required, even if it is only a matter of allowing the laser beam to interact with the sample for long enough (perhaps several hundred laser pulses) to remove surface contamination and/or oxide layers before attempting to record spectra. Another often stated attribute of LIBS is that it is fast. This is usually true, and with LIBS one can generate at great speed an enormous quantity of completely useless data! Assuming appropriate care is taken over the measurement conditions and methodology, however, a measurement precision of better than 1% is often achievable, even when using LIBS to remotely analyse a material. Detection limits vary significantly with the element of interest and the composition and physical form of the matrix but are usually in the range 0.1–100 ppm.
For remote LIBS applications, there are two general designs of LIBS system. The first is basically a telescope design, where the laser beam is transmitted to the sample via line-of-sight, and the second design utilises a fibre-optic cable terminated with a remote probe to transmit the laser beam to the sample. Both designs have been used in industrial applications, examples of which are discussed later in this article.
Qualitative vs quantitative measurements
Qualitative information on the elemental composition of a material is relatively simple to obtain using LIBS. In essence all that is required is to simply focus the output of a suitably powerful pulsed laser onto the surface of the material and record the emission spectra from the resultant plasma, bearing in mind the above comments on the limitations inherent in surface analysis. Identification of the various emission lines using reference tables or suitable software will then yield information on which elements are contained within (or on!) the sample, subject to the usual limitations of measurement sensitivity. Quantitative measurements, however, are much more difficult, especially if a reasonable level of precision and accuracy is required. The key requirements for quantitative measurements by LIBS are i) a high degree of control over the measurement conditions to ensure reproducibility, and ii) the availability of matrix-matched reference materials with which the LIBS system may be calibrated.
The former is by far the most difficult to achieve, especially if LIBS is to be used for remote characterisation of materials. The measurement conditions used during calibration must be reproduced when conducting a measurement of an “unknown” sample and, for remote applications, this is often not a trivial exercise. Perhaps of primary importance is the laser power density on the surface of the sample, variations in which will have a dramatic influence on the recorded spectra. At first sight it may appear fairly trivial to maintain the required power density but this can change in subtle ways. It is clearly necessary to maintain the correct laser pulse energy and spot size on the sample, but the spot size is a function of the relative position of the sample surface and focal plane of the laser beam and, during remote LIBS analysis, this can be very difficult to control. The action of the laser beam on the surface of the material can also cause a gradual change in measurement conditions by the formation of a tiny crater. For a solid sample such as steel or aluminium alloy, the combined effect of surface contamination and/or oxide layers and crater formation can readily be observed by recording a series of single-shot spectra (i.e. one spectrum recorded for each laser pulse) and comparing the spectra from successive laser shots. As can be seen in Figures 2 and 3, the first few laser pulses produce spectra that are significantly different from those of subsequent pulses. After a certain number of laser pulses, the intensities (and more importantly, the intensity ratios of an analyte line and matrix line) of the observed spectra become more stable. It is therefore normal to allow the laser beam to interact with the surface of the material for a measured number of pulses, after which spectra may be recorded for the purpose of determining the concentration of the analyte in the sample. There are, of course, many other factors that can influence the measurement conditions and these must be accounted for when attempting to perform remote, quantitative measurements by LIBS.
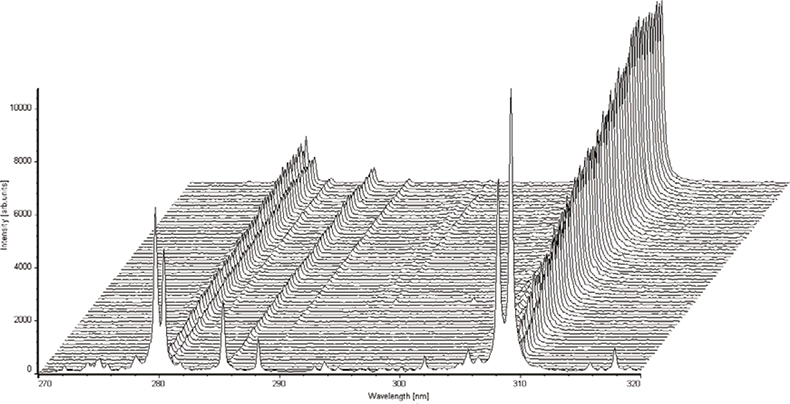
Figure 2. A series of single-shot spectra (60 in total, 1st in foreground) obtained from an aluminium alloy sample.
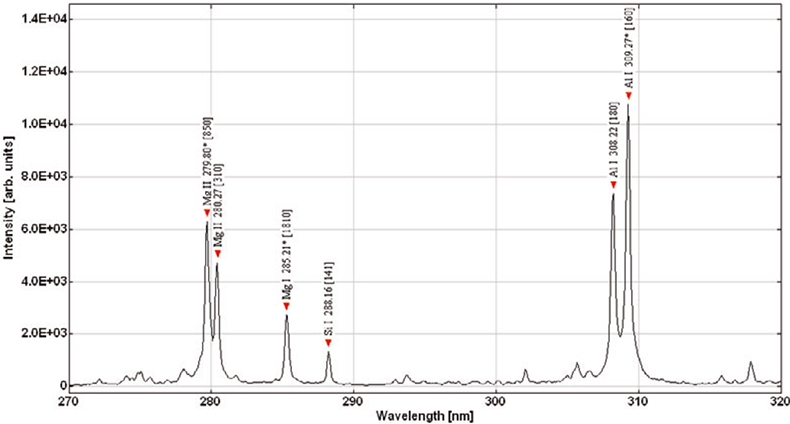
Figure 3. Atomic and ionic emission lines identified in the first spectrum (corresponding to first laser pulse).
Applications
There are numerous reports in the literature of “real-world” applications of LIBS, many of which are described in recent publications.4–7 Two industrial applications involving hazardous materials and hostile environments are summarised here, both of which were conducted in recent years by Applied Photonics Ltd for the UK nuclear industry.8,9
In situ compositional analysis of advanced gas-cooled reactor steam generator tubes
A lifetime review for the UK’s Hunterston “B” and Hinkley Point “B” Advanced Gas-Cooled Reactor (AGR), see Figure 4, nuclear power stations identified superheater steam tube bifurcation cracking as a commercial threat to the estimated 35-year operation of the boiler plant. Inspection of up to 528 bifurcations in each of four reactors was required in order to identify the components that were at risk of failure prior to the end of station life. The material properties of the bifurcation casts are primary factors in determining the risk of an individual component failing. A survey of the boiler manufacturing case history identified a number of casts having low creep ductility properties leading to an increased risk of the component failing within the remaining operating life of the stations. The location of these low creep ductility casts within the total population of 2112 bifurcations was, unfortunately, not known. It was known that the low creep ductility casts exhibited abnormally high copper content in comparison to other 316H stainless-steel casts. In-vessel measurements of the copper content of the bifurcations could, therefore, be used to quickly identify the components manufactured from this cast allowing further inspection techniques and repair procedures to be targeted only where necessary.
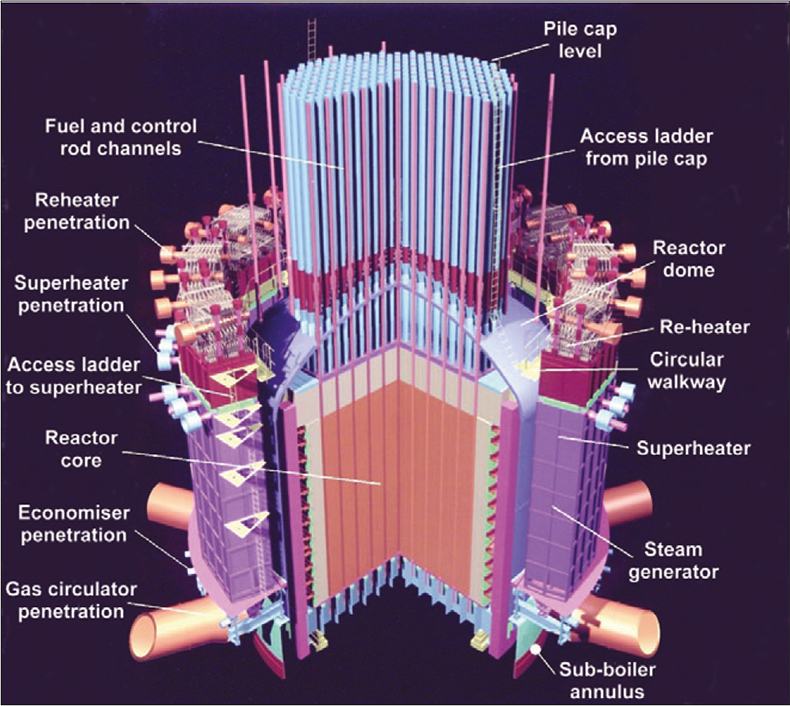
Figure 4. Schematic of an AGR.
A fibre-optic LIBS instrument based on a fibre-coupled remote probe was chosen as being suitable for this application, see Figure 5. The instrument was to be deployed during a routine reactor outage programme with the LIBS control module housed in a safe area above the pile cap and the probe/umbilical deployed within the reactor pressure vessel via a man-access route, see Figure 6. The environment of the vessel is such that the umbilical and probe needed to be able to withstand temperatures of around 60°C, radiation dose rates of up to 2 mSv hr–1 and be sufficiently rugged to minimise risk of damage from mechanical shock and rough handling. In order to access each of the 528 bifurcations in a reactor, a 75 m long umbilical was required; this length being far in excess of any previously reported industrial application of a fibre-optic LIBS system. A single optical-fibre design was used as previous work at our laboratories had demonstrated that this is the most simple, practical and efficient configuration of a fibre-optic LIBS system. The analytical requirements of this application were such that the copper content of each bifurcation needed to be established as being low (<0.06%), intermediate (0.06% < Cu ≤ 0.2%) or high (>0.4%).
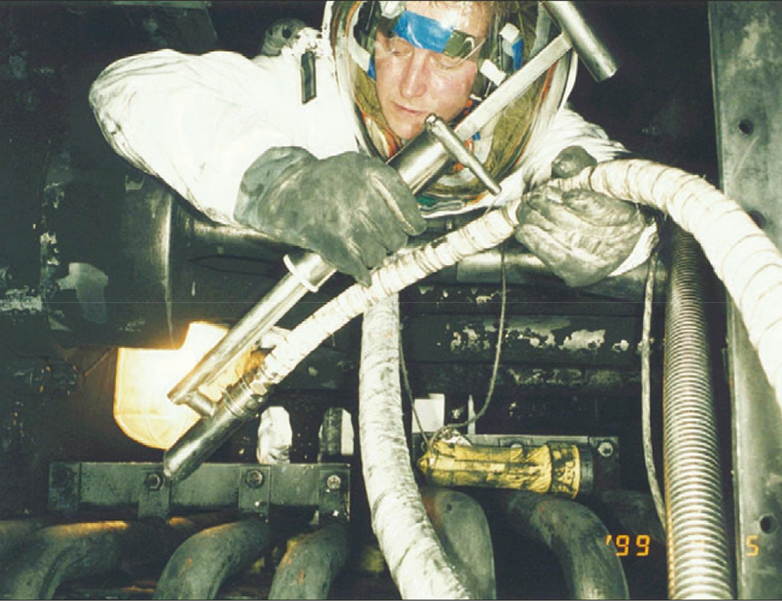
Figure 5. Deployment of the LIBS probe within an AGR superheater.
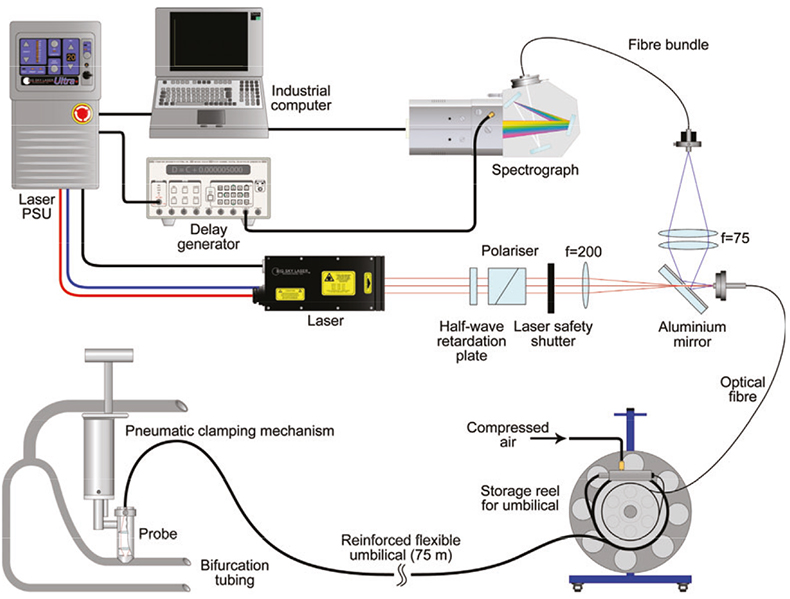
Figure 6. Schematic of the fibre-optic LIBS instrument deployed at the AGR nuclear power stations.
The system was used during the routine reactor outage programmes for these stations during the summer of 1999 and was able to determine the copper content over the range 0.04–0.60% (by mass) of each bifurcation to an accuracy of approximately ±25% and with a measurement time per bifurcation of less than 3 min.
Remote characterisation of high-level radioactive waste at the THORP nuclear reprocessing plant
In the THORP (Thermal Oxide Reprocessing Plant) facility at Sellafield, West Cumbria, UK, spent fuel from nuclear reactors from around the world is sheared into short pieces between 2.5 cm and 10 cm in length as a precursor to fuel dissolution. The sheared fuel pieces, comprising metal cladding and fuel, fall down a chute into a perforated basket that is suspended in hot (90°C) 7 M nitric acid. For operational reasons, the plant uses a total of seven baskets. As a consequence of increased levels of corrosion of the baskets it became necessary to replace them to allow continued operation of the dissolution cycle.
Routine camera inspections had identified an accumulation of a solid material in the upper, vapour area of the basket. Characterisation of this material was required to aid waste sentencing of the redundant baskets. Radiometric measurements were taken to identify the radionuclide inventory of the deposit but as these provided no information on the non-radioactive components, full characterisation was not possible. Due to the difficulties in taking an active sample from behind the biological shield and the subsequent difficulties with laboratory analysis, a remote method for analysis was investigated.
Optical access to the material was possible via a 1-metre thick lead-glass radiation shield window, see Figure 7. The component could be positioned approximately 3m beyond the window and raised/lowered by means of a hoist within the hot cell. In September 2001 Applied Photonics Ltd carried out the first remote analysis of a material within a hot cell by directing the laser beam of a telescope LIBS instrument through a lead-glass radiation shield window.
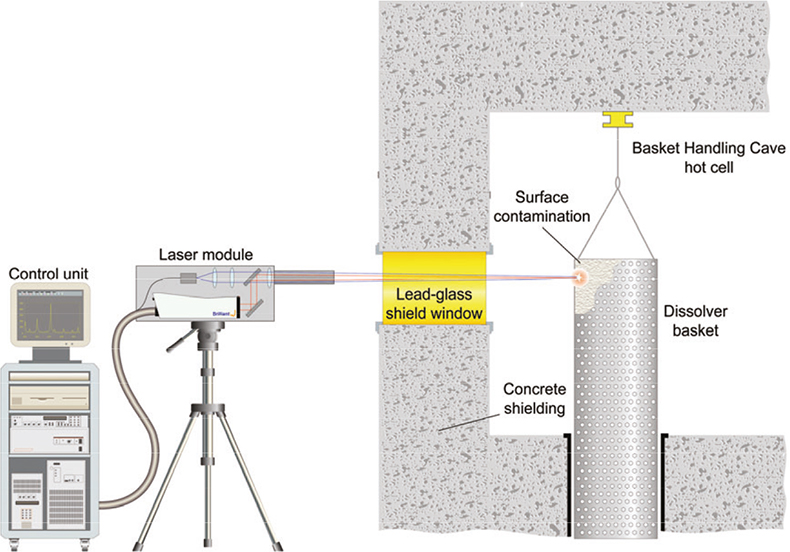
Figure 7. Schematic showing the deployment of the telescopic LIBS instrument at the THORP plant.
The results of the analysis showed that the contaminant material was rich in zirconium and molybdenum. Combining this information with existing knowledge of the chemistry of the process, it was deduced that the contaminant material consisted mainly of zirconium molybdate—a material that is known to form during the reprocessing of spent fuel and which is largely insoluble in nitric acid. The results of the LIBS measurements combined with the radionuclide analysis confirmed that an existing on-site storage facility could accept the redundant dissolver baskets.
The future
During the last 12 months or so, there has been significant interest in using LIBS for stand-off detection of hazardous materials at distances of 100 m or more,10 see, for example, Figure 8. The US Department of Defense has recently announced a requirement for stand-off detection of explosives and other materials at distances of up to 400 m.11 LIBS is viewed as being a key candidate technology for this application and during the last several months a number of experimental prototype Stand-Off LIBS (ST-LIBS) systems have been designed and manufactured as part of a collaborative effort involving Applied Photonics Ltd (UK), Ocean Optics Inc. (USA), University of Malaga (Spain) and US Army Research Laboratory (Aberdeen Proving Ground, USA). Double-pulse LIBS, in which two laser pulses separated in time by several μs are used in place of a single laser pulse, has been shown to improve measurement sensitivity in some applications. It is anticipated that other laser spectroscopic techniques including Raman spectroscopy will be integrated with ST-LIBS as part of this R&D effort with the aim of improving detection capability and performance.
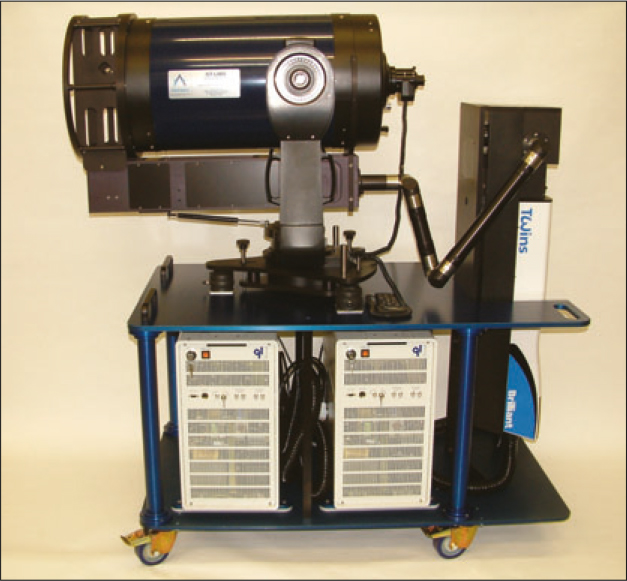
Figure 8. Experimental prototype double-pulse ST-LIBS system capable of operating at a range of 60 m.
References
- F. Brech and L. Cross, Appl. Spectrosc. 16, 59 (1962).
- P.D. Maker, R.W. Terhune and C.M. Savage, “Optical third harmonic generation”, 3rd Internat. Conf. on Quant. Electron., Paris, France (1963).
- E.F. Runge, S. Bonfiglio and F.R. Bryan, Spectrochim. Acta 22, 1678–1680 (1966).
- “Atomic Spectroscopy Special Issue LIBS 2000 1st International Conference on Laser induced plasma spectroscopy and applications”, Spectrochim. Acta B 56B(6), (2001).
- Laser-Induced Breakdown Spectroscopy, Appl. Optics 42(30), 5929–6232 (2003).
- A. Miziolek, V. Palleschi and I. Schechter (Eds), Laser Induced Breakdown Spectroscopy: Fundamentals and Applications. Cambridge University Press (due to be published 31 July 2006).
- D. Cremers and L. Radziemski, Handbook of Laser-Induced Breakdown Spectroscopy: Methods and Applications. John Wiley & Sons, New York (due to be published 21 April 2006).
- A.I. Whitehouse, J. Young, I.M. Botheroyd, S. Lawson, C.P. Evans and J. Wright, Spectrochim. Acta B 56, 821–830 (2001).
- A.I. Whitehouse, J. Young, C.P. Evans, Extreme LIBS. Presented at LIBS 2002, 25–28 September, Orlando, Florida, USA (2002).
- C. Lopez-Moreno, S. Palanco, J.J. Laserna, F. DeLucia Jr, A.W. Miziolek, J. Rose, R.A. Walters and A.I. Whitehouse, J. Anal. At. Spectrom. 21, 55–60 (2006).
- http://www.darpa.mil/mto/solicitations/baa06–17/s/ Section2.html (last checked 22 March 2006).

