

Richard Lee,a Vitaly Lashin,b Andrey Paramonovb and Alexandr Sakharovb
aAdvanced Chemistry Development, Inc. (ACD/Labs), 8 King Street East, Toronto, ON. M5C 1B5, Canada
bACD/Labs, Moscow, Russia
Introduction
MetID challenge
MetID typically requires analysis of mass spectrometry (MS) data to identify metabolic “hot spots” and elucidate biotransformation pathways. This remains the primary challenge despite significant instrumental and software advances.
MetID solution
MetaSense™ overcomes these challenges and allows users to save time and improve collaborations via:
- AUTOMATED identification of predicted and unexpected metabolites
- AUTOGENERATED biotransformation maps, stability and pharmacokinetic plots, and reports
- INTERACTIVE SEARCHABLE DATABASE associates spectral and chromatographic data
- WEB PORTAL offers customer access to your results and reports
Experimental
Samples
Test articles were added to rat liver microsomal protein and samples were collected at four incubation time points:
- Test articles at a concentration of 10 mM in DMSO were dispensed by an acoustic dispenser (25 nL) to 25 μL 10 mM phosphate buffer (pH 7.4) containing 2 mM NADPH.
- This solution (12.5 μL) was added to 12.5 μL rat liver microsomal protein (1 mg mL–1).
- The reactions were terminated by the addition of 10 μL acetonitrile/formic acid (93 : 7) at four specific time points (0, 2, 5 and 10 min).
Data acquisition
- Elite Hybrid Velos Pro Ion Trap/Orbitrap MS
- ESI source in positive mode
- Data-dependent acquisition based on a list of m/z values of potential metabolites
- Resolution of 30,000 (full scan), 15,000 (HCD) MS2
Automated Workflow
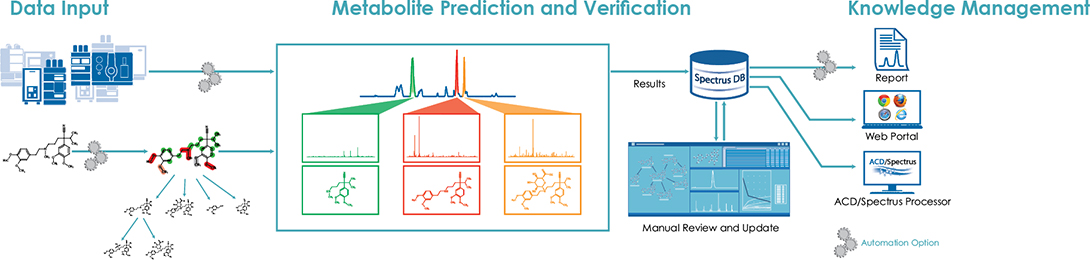
Figure 1. Automated workflow.
1. Data Input
LC/MS datasets across four incubation time points were batch processed. Parent structure files, along with the datasets, were automatically processed within the new software routine.
2. Metabolite Prediction and Verification
The predicted metabolites were restricted to phase 1 and 2. Metabolite target lists were generated in three parts:
i. A regio-selective model was used to predict expected metabolites.
- A probabilistic statistical model was applied to determine the likelihood of a metabolic reaction taking place at each potential site of metabolism in the compound of interest to identify hotspots
- Once potential metabolic hotspots were established, they were checked against a database of biotransformation rules to assess the types of metabolic reactions that are defined for the respective site of metabolism
- The selected biotransformation rules were applied to generate metabolite structures
- Markush structures could also be generated when the algorithm was not able to determine a discrete structure, which was not the case for this study
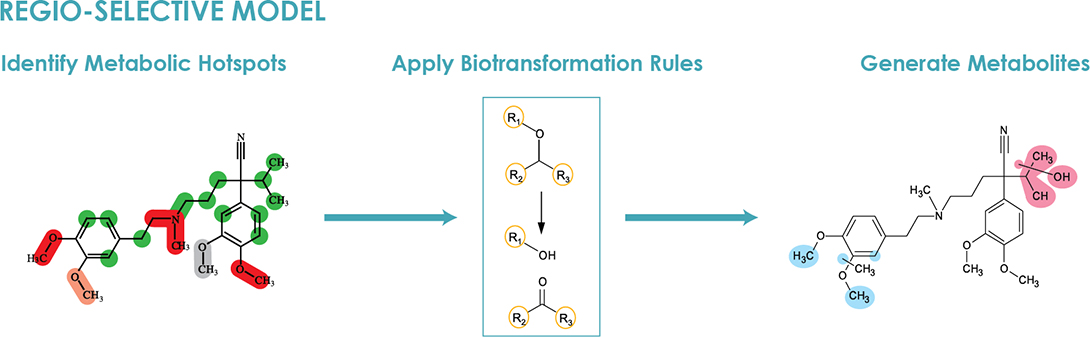
Figure 2. Regioselective model.
ii. Predicted metabolites were detected based on their accurate mass and theoretical isotope pattern calculated from molecular formulae. Unexpected metabolites were identified using a complementary procedure employing a fractional mass filter.
iii. Structure verification was performed by comparing the MS2 spectra of the parent and metabolite, and fragmentation analysis was performed on the parent structure to assign fragments to the MS2 spectrum. Once assigned, the parent and metabolite MS2 spectra were compared (as shown in the Metabolic Centric View). Pairs of ions were grouped together by correlating common mass shifts, i.e., if two ions were separated by ∆14 (demethylation), as shown in Figure 3.
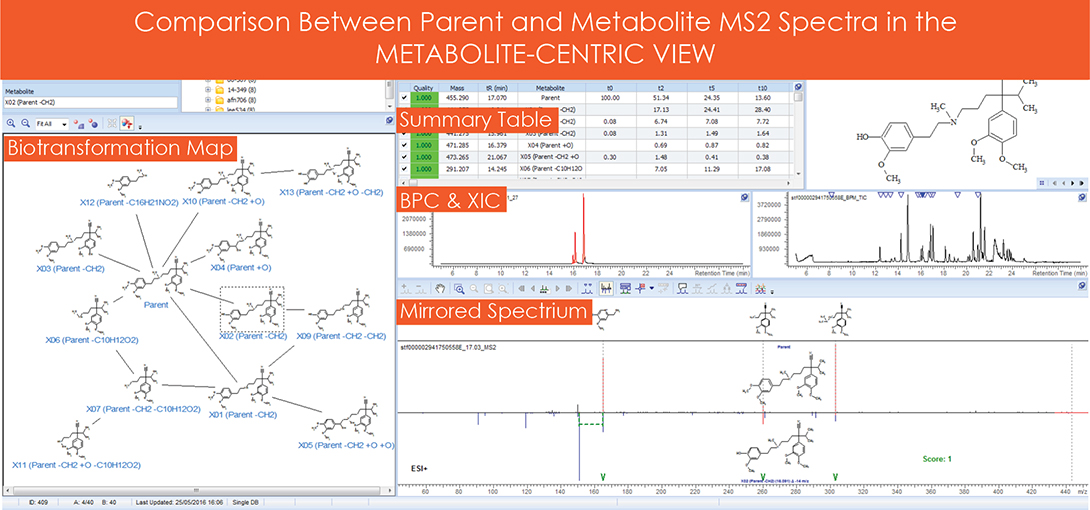
Figure 3. Metabolite centric view.
3. Interactive Knowledge Management
Knowledge Database
A summary of the data was automatically generated and updated to an interactive knowledge database upon completion of the data processing routine. As shown in Figure 4, both the predicted and unexpected metabolites were combined into a single biotransformation map, where all mass spectra were associated to each of the structures. A summary table of all detected components was generated from the peak areas of the parent and metabolites across all incubation times. Peak areas from the summary table were graphically represented as stability and kinetic plots.
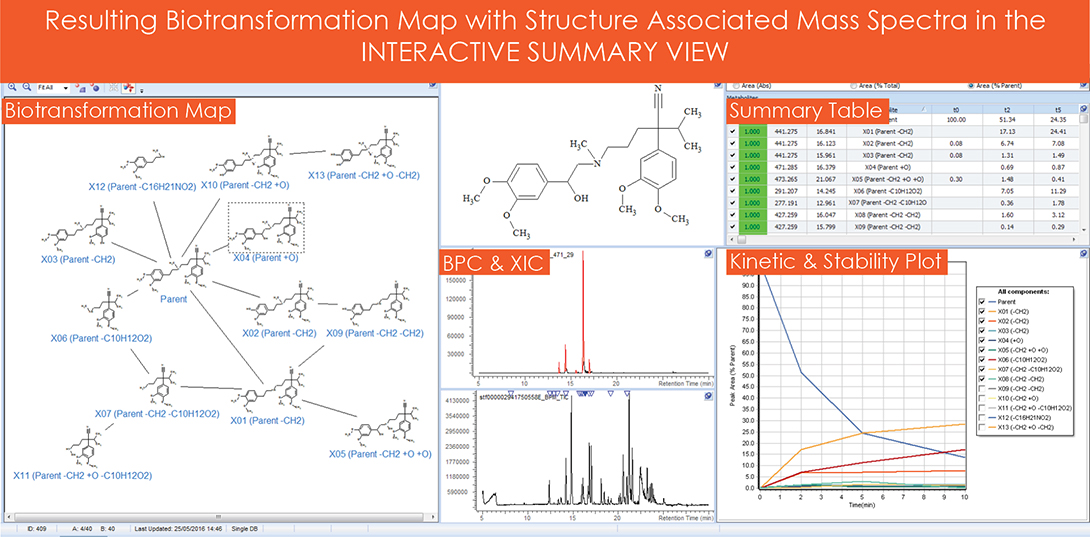
Figure 4. Summary view.
Web Portal
A java based web portal was designed to communicate the results and increase collaborative efforts. The viewer in this case includes a display of the biotransformation map as the main feature. Users have several search options:
- Metadata search
- Search by substructure, similar structure, and exact structure
- Search via the drawing applet within the web portal
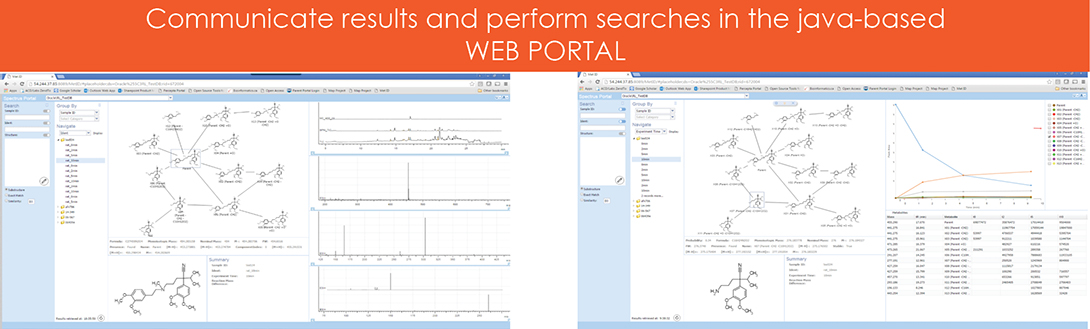
Figure 5. Web portal.
