Felix Scholkmann* and Martin Wolf
Biomedical Optics Research Laboratory, Division of Neonatology, Department of Obstetrics and Gynaecology, University Hospital Zurich, 8091 Zurich, Switzerland. E-mail: [email protected]
Introduction
Since oxidative metabolism is the primary means of energy production in the brain and since the amount of oxidative metabolism varies depending on the brain’s state of activity, cerebral perfusion via blood flow and volume changes (haemodynamics) and changes in oxygen supply (oxygenation) need to be permanently regulated. The measurement of brain oxygenation and haemodynamics is not only important for a better understanding of the complex physiology to the brain but is also an essential part of modern medical diagnostics.
Thirty-five years ago, Franz Jöbsis published the first paper about a non-invasive in vivo measurement of brain oxygenation using near infrared spectroscopy (NIRS).1 This discovery paved the way for the development of a new kind of method to detect brain activity non-invasively: functional near infrared spectroscopy (fNIRS). In contrast to electroencephalography (EEG) and magnetoencephalography (MEG) which directly measure the electric or magnetic fields generated by neuronal activity, respectively, fNIRS monitors changes in the concentration of oxyhaemoglobin (O2Hb) and deoxyhaemoglobin (HHb) that accompany neuronal activity. In this respect, fNIRS is similar to functional magnetic resonance imaging (fMRI), which only measures changes in [HHb]. The term “functional” in fNIRS refers to the fact that NIRS is used to probe the function of the brain. For this purpose the subject performs a particular task that causes an event-related increase in neuronal activity that can be measured using fNIRS.
Over the decades and especially in recent years, fNIRS has been increasingly used, particularly in the field of brain research/neuroscience. This article describes the principle of fNIRS and presents examples of how it can be applied to detect neuronal activity.
Biophysical and technical principles of fNIRS
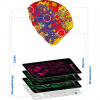
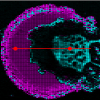
Functional NIRS usually refers to a point measurement of haemodynamic and oxygenation changes at one location. In contrast, when the measurement is performed at different locations simultaneously and when the information is processed to create an image of the area probed, the method is called near infrared imaging (NIRI) [also known as diffuse optical imaging (DOI)]. In the case of a depth-resolved processing of the information, the method is called near infrared tomography (NIRT) [also known as diffuse optical tomography (DOT), near infrared optical tomography (NIROT)]. In the present article we will focus only on fNIRS. All the techniques have in common that they are based on three underlying principles: (i) light in the near infrared (NIR) range (approx. 650–950 nm) can penetrate the head up to a few centimetres deep due to low absorption of the skin, skull and brain tissue (“optical window”) in this wavelength range. The distance (d ) between the source and the detector determines the maximum depth (zmax) of tissue probed. The rule of thumb formula is: zmax = d / 2. (ii) The two chromophores with the strongest absorption in the NIR range are O2Hb and HHb. (iii) Changes in the concentration of these two chromophores are associated with changes in neuronal activity. The absorption spectrum of O2Hb and HHb is shown in Figure 1(a). A simulation of NIR light propagation in a human head is depicted in Figure 1(b).
 Absorption spectrum of oxyhaemoglobin (O2Hb) and deoxyhaemoglobin (HHb). (b) Typical photon migration in case of a cw-fNIRS system.2 (c) Typical evoked changes in cerebral oxygenation of haemodynamics due to an increase in brain activity.")
 temporal point spread function of the transmitted light signal.")
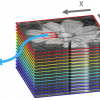
From a technical point of view, fNIRS can be implemented using three different methods shown schematically in Figure 2 for transmission measurements: time domain (td-fNIRS), frequency domain (fd-fNIRS) and continuous wave (cw-fNIRS) measurements. In practice, all the methods have in common that light is introduced into the tissue and the intensity of the diffusely reflected light is measured. Highly sensitive light detectors are used since the reflected light is very weak. To avoid damage to the tissue, the light used averages only a few mW mm–2 and the elevation in skin temperature due to NIR absorption is less than 0.5°C. The introduction and measurement of the light varies according to the three methods as follows:
- td-fNIRS: the light introduced into tissue is a short light pulse in the range of picoseconds. The broadening and attenuation of the diffuse reflected light pulse are measured. This provides information about tissue absorption and scattering.
- fd-fNIRS: the light intensity introduced into tissue is amplitude-modulated (at frequencies in the order of tens to hundreds of MHz). The amplitude and the phase shift of the diffusely reflected light intensity with respect to the incident light signal are recorded which enables absorption and scattering properties of tissue to be determined.
- cw-fNIRS: the light introduced into tissue is a signal with constant intensity or a amplitude-modulated signal (a few tens of kHz). Absorption changes are determined by measuring the attenuation of the incident light.
Each of these methods has advantages and drawbacks. For example, td-fNIRS contains the most information, has a good spatial resolution in imaging and enables the removal of the effects of superficial tissue. In contrast, the implementation is technically complex, expensive and the sampling rate is low. fd-fNIRS and cw-fNIRS can have a much higher sampling rate (for example, 100 Hz). An accurate separation of absorption and scattering changes is realised by fd-NIRS, whereas cw-fNIRS allows only the measurement of relative absorption changes. cw-fNIRS has the great advantage of being technically realised in a way that is simple and cost-efficient. For most of the fNIRS studies in the field of neuroscience, fd-fNIRS or cw-fNIRS data have been used.
All the three methods enable a direct determination of [O2Hb] and [HHb] time series. These time series can be further used to determine the total haemoglobin concentration ([tHb]), which is given by [tHb] = [O2Hb] + [ HHb] and the tissue oxygen saturation (StO2) given by StO2 = 100 × ([O2Hb] / [tHb]).
Neuroscientific applications
Detection of cerebral haemodynamic and oxygenation changes
An increased brain activity (i.e. neuronal firing) causes a regional increase in oxygen consumption (CMRO2) and an increase in the cerebral blood flow (CBF) and blood volume (CBV)3 which leads to an increase in StO2, [O2Hb] and [tHb] and a decrease in [HHb]. The interaction between neuronal activity and changes in haemodynamics as well as oxygenation is called neurovascular coupling—a fundamental physiological principle that enables fNIRS to detect changes of the brain activity. The relationship between neurovascular coupling and changes in the fNIRS-derived signals is illustrated in Figure 3.
 activity.")
In an experimental setting, an increased brain activity and, thus, an evoked response in cerebral haemodynamics and oxygenation can be caused by different stimulations such as motor (for example, finger tapping, hand movements), visual (for example, looking at a changing checkerboard pattern or flashing light), auditory (for example, tones, speed or music), olfactory (for example, smelling the scent of a rose, black pepper oil etc.), gustatory (for example, tasting a hot spice) or somatosensory (for example, flexion and extension of an arm, pain). In general, these stimulations cause characteristic evoked changes in the fNIRS-derived parameters: StO2 ↑ [O2Hb] ↑ [tHb] ↑ and [HHb] ↓ during the stimulation period [see Figure 1(c)]. The time dynamics of the signals are called “haemodynamic response” or “slow signals”. The fNIRS-measured cerebral haemodynamic and oxygenation changes can be used in different neurophysiological or clinical settings. For example, fNIRS studies showed that:
- in healthy term newborns, a significant increase in cerebral [O2Hb] and StO2 and a significant decrease in [HHb] occur during immediate adaptation, reaching a steady plateau at around eight minutes after birth.4
- the imagination of finger-tapping in adult recruits was observed to cause a significant haemodynamic and oxygenation change in the motor cortex.5
- during exposure with a UMTS high-frequency electromagnetic field (1.9 GHz, SAR = 0.18 W kg–1), increases in [O2Hb] and [tHb] in the brain were found.6
- by measuring the cerebral haemodynamic and oxygenation changes of the anterior frontal cortex, fNIRS is able to decode whether a human likes or dislikes a presented visual object.7 Thus, fNIRS is able to capture neurobiological correlates of human mental states.
These examples show that fNIRS can be used in a great variety of ways to investigate neuroscientific and medical topics.
Detection of fast neuronal optical signals
Besides the changes in cerebral haemodynamics and oxygenation evoked by brain activity, several studies using single neurons showed that approximately 50–200 ms after neural firing a transient change in the optical properties occurs (mainly refractive index and reflective properties). This change is associated with changes in the membrane potential8 and might be attributed to transient cellular volume changes (tCVC) that happen during neuronal firing.9
It was proven10 that fNIRS is, in principle, able to measure these short and small optical property changes related to neuronal activity which are termed “neuronal optical signal”, “event-related optical signal” (EROS) or simply “fast signal”. The measurement is a technical challenge mainly due to the fact that the changes are extremely small, i.e. when using cw-fNIRS a maximum intensity change (ΔI / I ) in the order of 0.01% is expected; when using td-fNIRS the expected maximum change of the mean time of flight (Δ< t >) is in the extremely short time range of 10–2 ps. As a result, 500–1000 stimulations need to be performed in order to detect neuronal optical signals.
Improving the detection of neuronal optical signals is an ongoing research topic in the field of fNIRS basic research. The major goal is to develop a framework that allows a robust measurement of neuronal optical signals in vivo non-invasively on the human brain—ultimately in clinical situations.
Outlook
After several decades of intensive basic and applied research using fNIRS, the usage of fNIRS is now an integral part of the modalities used in neuroscience. The optimisation of the sensitivity, resolution and accuracy of fNIRS is an intensive research topic and will improve the applicability of fNIRS in clinical settings in the future. Continuously improving and optimising NIR imaging and tomography techniques will remain an important goal of future NIR research. fNIRS is non-invasive, safely applicable, portable and cost-effective. These properties are highly appreciated by all people involved in neuroscientific and biomedical research.
References
- F.F. Jöbsis, “Noninvasive, infrared monitoring of cerebral and myocardial oxygen sufficiency and circulatory parameters”, Science 198, 1264 (1977). doi: 10.1126/science.929199
- F. Qianqian and D.A. Boas, “Monte Carlo simulation of photon migration in 3D turbid media accelerated by graphics processing units”, Opt. Express 17(22), 20178 (2009). doi: 10.1364/OE.17.020178
- R.B. Buxton, “Dynamic models of BOLD contrast”, Neuroimage, 62(2), 953 (2012). doi: 10.1016/j.neuroimage.2012.01.012
- J.C Fauchère, G. Schulz, D. Haensse, E. Keller, J. Ersch, H.U. Bucher and M. Wolf, “Near-infrared spectroscopy measurements of cerebral oxygenation in newborns during immediate postnatal adaptation”, J. Pediatr. 156(3), 372 (2010). doi: 10.1016/j.jpeds.2009.09.050
- L. Holper and M. Wolf, “Motor imagery in response to fake feedback measured by functional near-infrared spectroscopy”, Neuroimage 50(1), 190 (2010). doi: 10.1016/j.neuroimage.2009.12.055
- S. Spichtig, F. Scholkmann, L. Chin, H. Lehmann and M. Wolf, “Assessment of intermittent UMTS electromagnetic field effects on blood circulation in the human auditory region using a near-infrared system”, Bioelectromagnetics 33(1), 40 (2012). doi: 10.1002/bem.20682
- S.M. Hosseini, Y. Mano, M. Rostami, M. Takahashi, M. Sugiura and R. Kawashima, “Decoding what one likes or dislikes from single-trial fNIRS measurements”, Neuroreport 22(6), 269–273 (2011). doi: 10.1097/WNR.0b013e3283451f8f
- R.A. Stepnoski, A. LaPorta, F. Raccuia-Behling, G.E. Blonder, R.E. Slusher and D. Kleinfeld, “Noninvasive detection of changes in membrane potential in cultured neurons by light scattering”, Proc. Nat. Acad. Sci. USA 88(21), 9382–9386 (1991).
- J. Lee and S.J. Kim, “Spectrum measurement of fast optical signal of neural activity in brain tissue and its theoretical origin”, Neuroimage 51(2), 713–722 (2010). doi: 10.1016/j.neuroimage.2010.02.076,
- G. Morren, M. Wolf, P. Lemmerling, U. Wolf, J.H. Choi, E. Gratton, L. De Lathauwer and S. Van Huffel, “Detection of fast neuronal signals in the motor cortex from functional near infrared spectroscopy measurements using independent component analysis”, Med. Biol. Eng. Comput. 42(1), 92–99 (2004).