A.M.C. Daviesa and Tom Fearnb
aNorwich Near Infrared Consultancy, 75 Intwood Road, Cringleford, Norwich NR4 6AA, UK. E-mail: [email protected]
bDepartment of Statistical Science, University College London, Gower Street, London WC1E 6BT, UK. E-mail: [email protected]
Introduction
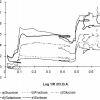
The last TD column1 showed the effect of calculating second derivatives on a set of 100 spectra, which will be the starting point for this column. In order to remind you where we had got to, the last graph is plotted again as Figure 1. You may have been surprised that it was suggested that these second derivative spectra still contain irrelevant variability. The plan was that in this column we would discuss the two most popular methods of removing what is known as “multiplicative effects”, but we realised that in order to understand why we want to remove it you need to know where it has come from.
The multiplicative effect
Classical spectroscopy involves making measurements of absorptions in clear (usually liquid) media which can be computed by applications of “Beer’s Law” (properly called the Bouguer–Lambert–Beer law!). The complications of having a scattering (but non-absorbing) medium such as a turbid solution have been investigated by many scientists, but the greatest progress was made by Kubleka and Munk who showed that the pathlength in a scattering medium would be increased and that this gave rise to a multiplicative effect. This means that if the spectrum is transformed to a suitable scale then the differences caused by different scatter between (what should be) two identical samples can be corrected by multiplying the measurement at each wavelength of one of the samples by the same constant.
For those interested, a little more information will be found in the book2 and a lot more in a new book by Don and Kevin Dahm.3
If we consider a spectrum as being measured at n equally spaced wavelengths w1, w2, ..., wn , where the absorptions should be x1, x2, ..., xn , but these become modified by adding an off-set and slope by the equation
yi = a + bwi + xi
so that the measured absorptions become y1, y2, ..., yn then we can remove these additions by calculating the second derivative. The second derivative of the yi spectrum is identical to the one we would have obtained from the xi spectrum. However, when we measure spectra in a scattering medium, such as in diffuse reflection spectroscopy, then the multiplicative effect will occur. In terms of the previous notation, the xi spectrum is modified according to,
yi = a + bwi + cxi
Although many spectroscopists believe that taking second derivatives removes multiplicative effects, this is not the case as will be demonstrated by use of some computed spectra.
Computer modified spectra
In order to demonstrate the removal of these different effects we have a new set of spectra which were generated, as follows, from the upper spectrum in Figure 1; three have different off-sets, three have different off-sets and slopes, three have different multiplicative effects and three have different off-sets, slopes and multiplicative effects. They are all plotted in Figure 2. The spectra were generated in an Excel™ spreadsheet and then transferred to the Unscrambler™ program (Version 9.6, Camo AS, Oslo, Norway) and subjected to differing spectral pre-treatments; first derivative, second derivative and standard normal variate (SNV). SNV is one of the popular methods of correcting multiplicative effects invented by Ralf Barnes and colleagues.4
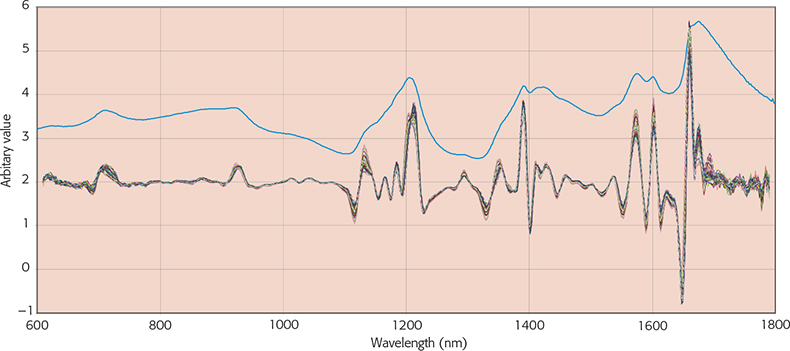
Figure 1. The first original spectrum (upper blue line) and the second derivatives of a set of 100 spectra. See Reference 1 for details.
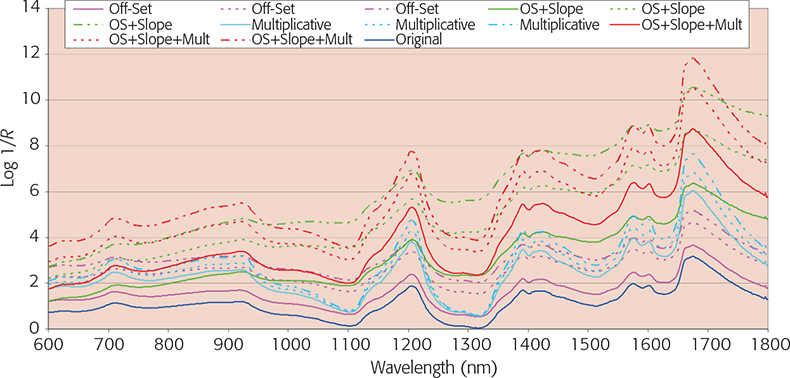
Figure 2. Original spectrum and 12 modifications.
What we hope to obtain are modified spectra which are identical to the original spectrum (after it has undergone the same pre-treatment). In the graphs that follow the “a” Figure shows all the successfully pre-treated spectra, which appear as a single spectrum while the “b” Figure shows all 13 spectra after the particular treatment.
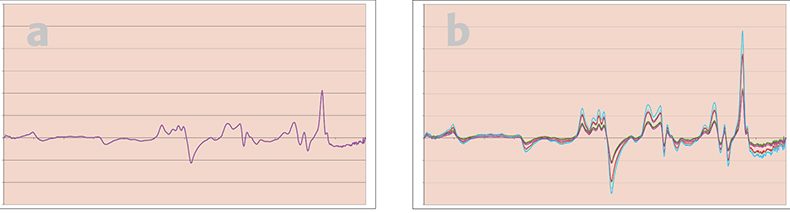
Figure 3. (a and b) Results of applying first derivative pre-treatment.
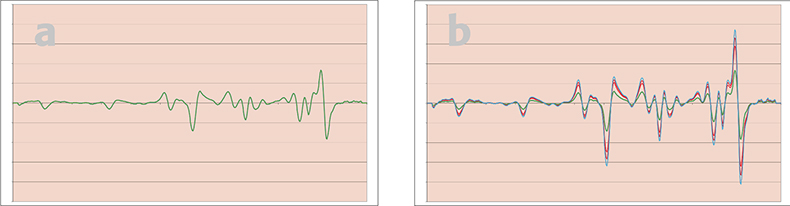
Figure 4. (a and b) Results of applying second derivative pre-treatment.
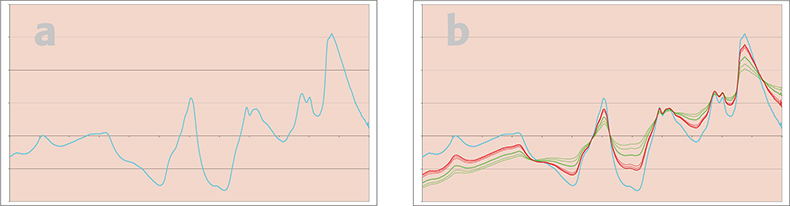
Figure 5. (a and b) Results of applying SNV pre-treatment.
Figure 3 shows the results of first derivative treatment, only the off-sets have been successfully removed. Figure 4 shows the results of second derivative treatment, off-sets and slopes have been removed. Figure 5 shows the result of SNV treatment, off-sets and multiplicative effects have been removed but not slopes. Figure 6 shows the result of second derivative followed by SNV, all 12 spectra are now identical to the similarly treated original spectrum. (Isn’t it fun when a demonstration works!)
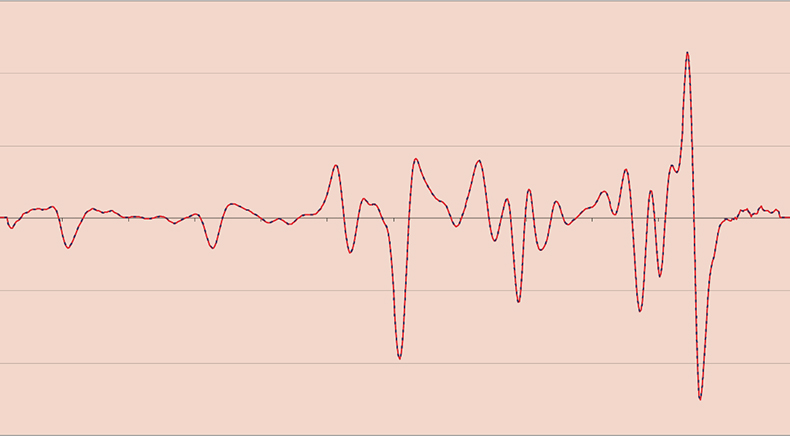
Figure 6. Results of applying second derivative followed by SNV pre-treatments.
In the next column we will explain how SNV and the other popular pre-treatment for removing multiplicative effects, multiplicative scatter correction (MSC),5 work and (if we have space) to see if this will give us an improved result for the problem described last year.6
References
- A.M.C. Davies, Spectrosc. Europe 19(2), 32 (2007).
- T. Næs, T. Isaksson, T. Fearn and T. Davies, A User-Friendly Guide to Multivariate Calibration and Classification. NIR Publications, Chichester (2002).
- D.J. Dahm and K.D. Dahm, Interpreting Diffuse Reflectance and Transmittance. A Theoretical Introduction to Absorption Spectroscopy of Scattering Materials. NIR Publications, Chichester (2007).
- R.J. Barnes, M.S. Dhanoa and S.J. Lister, Appl. Spectrosc. 43, 772 (1989).
- P. Geladi, D. MacDougall and H. Martens, Appl. Spectrosc. 39, 491 (1985).
- A.M.C. Davies, Spectrosc. Europe 18(6), 28 (2006).