A.H. Jean Robertson, Charles Shand and Estefania Perez-Fernandez
The James Hutton Institute, Craigiebuckler, Aberdeen, Scotland, AB15 8QH. E-mail: [email protected]
Introduction
Soil is critical to life on earth and provides not only the key functions of food and energy production but also many other important functions, such as water regulation and carbon sequestration.1 Soil is a highly complex material, consisting of an extremely variable mixture of minerals, organic matter, liquids and gases. Soils are heterogeneous on different scales: in the landscape they are heterogeneous both horizontally and vertically and generally occur in distinguishable layers termed horizons, as a result of modification of inputs and outputs over time.2 On the microscopic scale, soil can be even more heterogeneous, moving, for example, over a very short distance from a discrete mineral grain to a soil microbe. Soils can range from a mineral soil with almost no organic matter content to an entirely organic soil or peat. In the context of productive and sustainable agriculture there is a need to know soil properties such as pH, organic matter, and nutrient and pollutant concentrations. Traditionally, many soil analyses have involved wet chemical methods with liquid extraction and subsequent analysis of solutions with laboratory-based instruments. For example, the determination of the micronutrient concentration of soil involves extraction with acids (typically HF/HNO3 or HNO3/HCl) and subsequent analysis by inductively coupled plasma (ICP)-based methods. Similarly, the determination of soil organic matter concentration has traditionally involved wet oxidation, although many laboratories now use combustion with CHN analysers. There is now a drive towards using dry chemical methods such as X-ray fluorescence (XRF) and infrared (IR) spectroscopic analysis which minimise cost, improve speed and reduce environmental impact and waste. At the James Hutton Institute (and the legacy institutes of the Macaulay Institute and Scottish Crop Research Institute) we have a long history of expertise in soil science and spectroscopic techniques, particularly of IR spectroscopy in the mid-IR range. In recent years we have been developing methods for Fourier transform (FT)-IR, near infrared (NIR) and XRF spectroscopic analysis of soil and creating databases of soil spectral data and calibrations to predict soil properties. Currently we are working to move from laboratory-based analysis towards the development of methodology for field-based soil analysis using FT-IR and XRF spectroscopy.
Spectroscopic analysis of soil Fourier transform infrared
The highly complex and variable nature of soil is reflected in the very different FT-IR spectra they produce in the mid-IR region (4000–400 cm–1) arising from the fundamental vibrations of the components present. Usefully, the mid-IR spectra provide an overall chemical profile of the soil, encompassing fundamental vibrations of both the organic and mineral components. The mineral components present in soil are predominantly silicates, including clay minerals (aluminosilicates), or carbonates, but can also include other types of minerals such as sulfates. Clay minerals play an important part in the properties of a soil and have free OH groups present in their structures3 (i.e. without hydrogen bonding). The O–H stretching bands for clay minerals (approximately 3700–3500 cm–1) are therefore sharp bands which are highly diagnostic. Si–O stretching vibrations are strong bands found close to 1000 cm–1, and those for the carbonate anion are close to 1400 cm–1. When considered in combination with the bending vibrations, below 900 cm–1, the individual minerals present can often be identified. For example, for carbonates, it is relatively easy to differentiate between calcite (calcium carbonate), aragonite (a different form of calcium carbonate) and dolomite (a calcium magnesium carbonate). Silicate minerals can also be identified from their bending vibrations, e.g. quartz can be readily identified by a sharp doublet at 797 cm–1 and 779 cm–1.4,5
The organic components present largely originate from vegetation and so the IR spectral features of soil organic matter (SOM) have much in common with IR spectral features of plants, although plants degrade to form other organic compounds such as humic and fulvic acids. A broad O–H stretch between approximately 3600 cm–1 and 3200 cm–1 is characteristic of SOM and the C–O stretch for polysaccharide is found at 1030 cm–1, which can coincide with the silicate stretch if minerals are also present. The C–H stretching region can reveal whether long chain molecules are present or whether the organic material is more polysaccharide based. In addition, functional groups present in the SOM such as those arising from esters, carboxylic acid, amide (protein) and lignin can be identified and hence the SOM characterised.6 Interpretation of FT-IR spectra therefore allows a rapid assessment of the relative proportions and nature of both SOM and clay minerals present and also the determination of the underlying mineralogy.
Generally, FT-IR spectroscopic analysis of soil samples in the laboratory is carried out on dried, milled samples, with an optimal particle size <2 µm, in order to avoid problems of reflection of the radiation, poor resolution of peaks and sloping baselines. An effective protocol for preparation of soil samples for FT-IR spectroscopic analysis, to allow the production of reliable and reproducible spectra, has been developed at the James Hutton Institute.7 Historically FT-IR spectroscopy of soils was carried out in transmission, using KBr discs prepared from the milled soil, but more recently, diamond attenuated total reflection (DATR) sampling accessories have become routinely used for soil analysis, having the advantage of allowing spectra to be recorded of unprocessed soil, automatically producing spectra of optimum intensity and being non-destructive. The spectra produced are similar in appearance to transmission spectra. Alternatively diffuse reflection or DRIFTS (diffuse reflection infrared Fourier transform spectroscopy) can be used for soil analysis. In this case the IR radiation is reflected from the external and internal surfaces of the sample, and this is also non-destructive and requires little sample preparation. DRIFTS spectra in the mid-IR region have a very different appearance to ATR or transmission spectra8 and can be more difficult to interpret.
Near infrared
While the fundamental vibrations of molecular bonds and functional groups occur in the mid-IR region, the NIR region extends between 750 nm and 2500 nm (i.e. 12,500–4000 cm–1) and consists of broad absorption bands, overtones and combinations of the fundamental absorptions found in the mid-IR range. NIR spectra contain absorbance bands mainly due to chemical bonds of C–H (fats, oil, alkanes), O–H (water, alcohol) and N–H (protein). Other chemical bonds may exhibit overtone bands in the NIR region, but are generally weaker. NIR spectra of soil therefore reflect the SOM and clay minerals well, but provide much less information on the full mineralogy of the samples than their counterpart mid-IR FT-IR spectra.
Although NIR spectra do not have the resolution of the mid-IR spectra, NIR has the advantage of being a more energetic radiation that penetrates deeper into samples thus allowing the scanning of samples with little, or no, previous preparation. Nonetheless, samples are usually dried and sieved to 1–2 mm for homogenisation purposes. The most common spectral collection mode used is diffuse reflection, in which the light interacts with the sample and re-radiates diffuse reflected energy, which is detected (and plotted as log 1/Reflectance) at a 45° angle in order to minimise specular reflection.
Its ease of use has given NIR spectroscopy some advantage over other techniques for soil analysis; however, the combinations and overtones that form the spectra conceal the sum of the numerous bands that correspond to functional groups present in the sample, making its interpretation more complex (Figure 1 illustrates the FT-IR and NIR spectra of the same peat sample). For this reason, NIR has traditionally relied on multivariate data analyses techniques (chemometrics) for the extraction of information and development of multivariate calibration models that correlate optical measurements with soil chemical or physical attributes under study, for predictive purposes.9 As opposed to FT-IR spectroscopy in the mid-IR region, which has mainly been used qualitatively, NIR spectroscopy is mostly used as a quantitative technique that provides a very rapid means of simultaneously measuring multiple physical and chemical properties of soil.

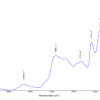
Figure 1. FT-IR and NIR spectra of the same highly organic soil sample with the soil profile.
X-ray fluorescence
Unlike the IR spectroscopic methods which are molecular, XRF using laboratory-based instruments has been a prime and widely used method for the determination of the elemental composition of soils. The main elements in soil expressed on a weight/weight basis are generally in the order O, Si, Al, Fe, C, Ca, K, Mg, Na, Ti, N and P. Soil also contains other minor elements, including those which are essential for plant growth such as Cu and Zn. The XRF method is based on excitation of the sample with a beam of X-rays resulting in the emission of secondary X-rays with energies characteristic of the elements in the sample (see, for example, Figure 3). To obtain reproducible and accurate data, soil samples are generally converted into a pressed disc or fused using a flux before pouring the melt into a mould to produce a glassy disc when cooled. These discs have a flat surface that is relatively homogeneous and so the sample is in a reproducible position in relation to the X-ray source and detector. With technological developments in devices for the production and detection of X-rays, portable XRF point and shoot instruments (PXRF) have become widely available and used on soil samples that have received little or no preparation apart from drying and milling. Because of the ease of use of PXRF, it is easy to obtain numerical data. However, appropriate calibration and checks are required to ensure accuracy of element concentrations. However, because of the low energies and absorption by air the determination of elements with atomic mass <12 by standard PXRF is challenging and requires the use of purging with He or use in a vacuum.
Application of the spectroscopic techniques to the National Soils Inventory of Scotland dataset
The James Hutton Institute holds the samples and data for the National Soil Inventory of Scotland (NSIS), a spatial dataset of soils sampled on a 20 km grid throughout Scotland.10 Both recently sampled (NSIS2, 2007–2009) and legacy samples (NSIS1, 1978–1988) from each of the discrete horizons of a pit profile at the 183 different sites were available for the spectroscopic analysis. FT-IR spectroscopic and XRF analysis was carried out on the top horizons of each pit profile, while all the pit profile samples available were analysed by NIR spectroscopy. Prior to all the analysis, the soil samples were air-dried at ~30°C, passed through a 2-mm sieve to remove stones, large roots or other debris, and representative subsamples taken with a spinning riffler or by coning and quartering. Further sample preparation, as described above, was carried out for each individual technique. The samples were also analysed by wet chemical methods for a wide range of analytes and properties, some by more than one method. Scottish soils have a great diversity and the dataset had % C values ranging from 1% to 50%.
FT-IR spectra of the milled soils were recorded on a Bruker Vertex 70 FT-IR spectrometer using a DATR accessory over the range from 4000 cm–1 to 400 cm–1 (ATR and baseline corrected). High quality FT-IR spectra were achieved for the Scottish Soil Spectral Database and they were shown to be highly reproducible and representative by comparisons between spectra of recently sampled and legacy soils from the same sites, with differences relating primarily to the SOM. This provided validation of all the sampling and preparation procedures used and therefore showed that it was possible to look at change in the soil profile over time. In addition to providing a comprehensive FT-IR spectral database for Scottish soils, successful calibrations have also been achieved for prediction of a number of soil parameters, including soil bulk density.
NIR spectra were recorded on 2-mm sieved soils using a Foss NIRSystems 5000 between 1100 nm and 2500 nm. Successful NIR spectroscopy calibrations, using a NIR spectral database created from the NSIS soil samples, have been developed for the prediction of a wide range of essential soil parameters, some of which were measured using different analytical techniques and therefore an interesting overview of the effects that different analytical techniques can have on calibration performance was provided.11
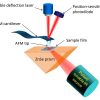
We analysed the elemental composition of the dried and milled NSIS2 topsoils by PXRF, using a Bruker S1TurboSD and 25-mm diameter plastic cups with a 4-µm thick polypropylene covering12 (Figure 2).

Figure 2. Portable XRF instrument on stand with sample holder and film located under the
radiation shield. The inset (bottom right) shows portable XRF being used in the field.
The soil samples were also analysed for inorganic element concentrations by aqua regia extraction/ICP spectrometry. In relation to PXRF, mineral soils behaved differently from organic soils and a different calibration to the soils programme supplied with the instrument is required for organic soils. An example, for the determination of Fe is shown in Figure 3. Aqua regia extraction data is often classified as “pseudo” total but the efficiency of extraction for many elements is far from complete. A comparison of data obtained by total dissolution of a typical mineral and a typical peat soil using HF and aqua regia extraction showed that Fe is only 84% and 87% extracted by aqua regia for the mineral and peat soil, respectively. This discrepancy partly explains the difference between PXRF and aqua regia data shown in Figure 3.

Figure 3. PXRF spectrum of a reference soil (left). Comparison of Fe concentration measured in mineral and organic soils by aqua regia extraction/ICP spectrometry, or directly by PXRF (see text for details).
The future—moving towards field-based spectroscopic analysis
Although most examples of soil IR spectroscopy are laboratory-based, another advantage is the potential adaptability of these techniques for field-based assessment of soils, a particularly relevant application nowadays given the increasing need for accurate and inexpensive spatial soil data for environmental monitoring and precision agriculture. NIR spectroscopic methodology for field analysis of soils is probably the most advanced of all three techniques13 discussed here, but at the James Hutton Institute we are concentrating on the potential for field-based FT-IR analysis.
Hand-held FT-IR instruments have relatively recently become readily available, with sampling accessories for both DRIFTS and DATR analysis, opening up the possibilities for field-based FT-IR spectroscopic analysis of soil. In situ analysis is on un-milled soil in the fresh state so in addition to particle size and inhomogeneity there are also moisture issues to deal with. Generally for ATR measurements of un-milled spectra there is a more sloping baseline, a lower intensity of most mineral bands and a greater relative intensity of bands due to clay minerals and SOM, which can actually be an advantage. Currently no methods or robust protocols for the field-based FT-IR spectroscopic analysis of soils exist and we are working to develop suitable methodology which will allow soil analysis in the field for a range of purposes including soil monitoring, agricultural and forensic work.
The technological advances in XRF have permitted the widespread use of affordable PXRF analysers, opening up XRF analysis to a wider audience of soil and environmental scientists and replacing the traditional methods of soil analysis involving chemical dissolution and subsequent analysis by ICP methods.14 PXRF can be used in the field directly on the soil surface (Figure 2). At the James Hutton Institute we are investigating this approach but surface roughness, heterogeneity and wetness are known15 to compromise performance. However, often in soil analysis, semi-quantitative data or data that reflect composition changes between sampling points are sufficient to meet the requirements. With an analysis time of 20 soil samples per hour. The detection limits for hand-held instruments are poorer by orders of magnitude than traditional wet chemical method involving analysis by ICP but they are often adequate for measurement of elements in soil that are subject to legislation governing maximum concentrations.
Acknowledgements
The authors would like to thank the NSIS team who carried out the soil sampling, processing and analyses; Angela Main and Renate Wendler for their support with the FT-IR spectroscopy and XRF analyses, and Tony Fraser for his expertise and advice in relation to the FT-IR. Finally, this work was funded by the Rural & Environment Science & Analytical Services Division of the Scottish Government.
References
- FAO and ITPS, Status of the World’s Soil Resources. Food and Agriculture Organization of the United Nations and Intergovernmental Technical Panel on Soils, Rome, Italy (2015). http://www.fao.org/documents/card/en/c/c6814873-efc3-41db-b7d3-2081a10ede50/
- R.R. Weil and N.C. Brady. The Nature and Properties of Soils, Fifteenth Edition. Pearson, Boston, USA (2016).
- R.E. Grim, Clay Mineralogy. McGraw Hill Book Company, New York (1953).
- V.C. Farmer, The Infrared Spectra of Minerals. Mineralogical Society, London (1974).
- M.J. Wilson, Clay Mineralogy: Spectroscopic and Chemical Determinative Methods. Chapman and Hall, London (1994). doi: http://dx.doi.org/10.1007/978-94-011-0727-3
- R.R.E. Artz, S.J. Chapman, J. Robertson, J.M. Potts, F. Laggoun-Defarge, S. Gogo, L. Comont, J.-R. Disnar and A.-J. Francez, “FTIR spectroscopy can be used as a screening tool for organic matter quality in regenerating cutover peatlands”, Soil Biol. Biochem. 40, 515–527 (2008). doi: http://dx.doi.org/10.1016/j.soilbio.2007.09.019
- A.H.J. Robertson, S.J. Hillier, C. Donald and H.R. Hill, “The NSIS Team (2013). A Robust FTIR Database for Scotland”, in Proceedings of the 3rd Global Workshop on Proximal Soil Sensing, 26–29 May 2013, Potsdam, Germany, pp. 182–185.
- T. Nguyen, L.J. Janik and M. Raupach, “Diffuse reflectance infrared Fourier transform (DRIFT) spectroscopy in soil studies”, Aust. J. Soil Res. 29(1), 49–67 (1991). doi: http://dx.doi.org/10.1071/SR9910049
- B. Stenberg, R.A. Viscarra Rossel, A.M. Mouazen and J. Wetterlind, “Visible and near infrared spectroscopy in soil science”, Adv. Agron. 107, 163–215 (2010). doi: http://dx.doi.org/10.1016/S0065-2113(10)07005-7
- A. Lilly, J. Bell, G. Hudson, A.J. Nolan and W. Towers, National Soil Inventory of Scotland 1 (NSIS_1): Site Location, Sampling and Profile Description Protocols (1978–1988). Technical Bulletin, Macaulay Institute, Aberdeen, UK (2010).
- E. Pérez-Fernández and A.H.J. Robertson, “Global and local calibrations to predict chemical and physical properties of a national spatial dataset of Scottish soils from their near infrared spectra”, J. Near Infrared Spectrosc. 24, 305–316 (2016). doi: http://dx.doi.org/10.1255/jnirs.1229
- C.A. Shand and R. Wendler, “Portable X-ray fluorescence analysis of mineral and organic soils and the influence of organic matter”, J. Geochem. Explor. 143, 31–42 (2014). doi: http://dx.doi.org/10.1016/j.gexplo.2014.03.005
- R.A. Viscarra Rossel, S.R. Cattle, A. Ortega and Y. Fouad, “In situ measurements of soil colour, mineral composition and clay content by vis–NIR spectroscopy”, Geoderma 150, 253–266 (2009). doi: http://dx.doi.org/10.1016/j.geoderma.2009.01.025
- D.C. Weindorf, N. Bakr and Y.D. Zhu, “Advances in portable X-ray fluorescence (PXRF) for environmental, pedological, and agronomic applications”, Adv. Agron. 128, 1–45 (2014). doi: http://dx.doi.org/10.1016/B978-0-12-802139-2.00001-9
- A.R. Schneider, B. Cances, C. Breton, M. Ponthieu, X. Morvan, A. Conreux and B. Marin, “Comparison of field portable XRF and aqua regia/ICPAES soil analysis and evaluation of soil moisture influence on FPXRF results”, J. Soil Sediment. 16, 438–448 (2016). doi: http://dx.doi.org/10.1007/s11368-015-1252-x